
Figure 1. DNA methylation in iPSCs is associated with genetic background, clone and passage (see also Figure S1).
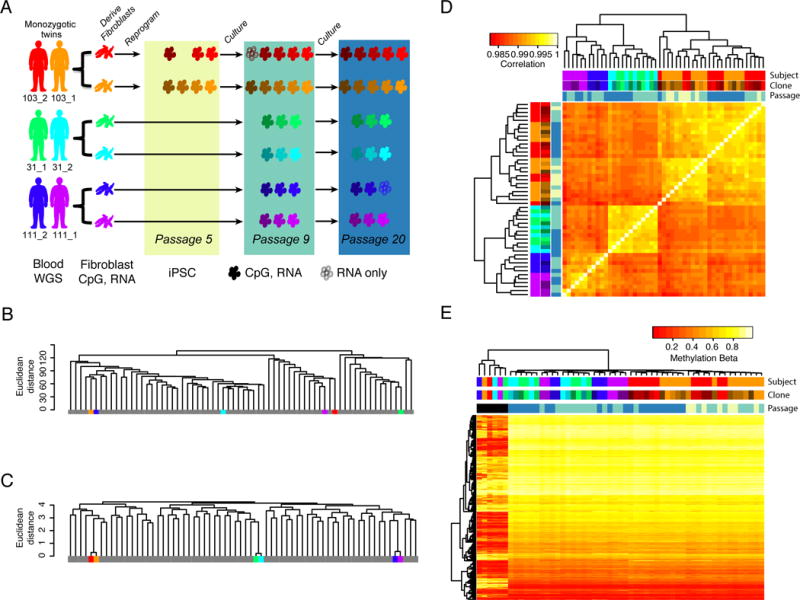
A) Study design indicating the fibroblast and iPSC samples derived from each subject in the three twin sets (103_2,103_1; 31_1,31_2; 111_2,111_1). iPSC clones are colored by shades of the subject’s color code and the colored rectangles depict indicated passages. Color codes are consistent throughout the paper. Blood samples were used for whole genome sequencing (WGS), while fibroblast and iPSC samples were used for DNA methylation (CpG) and RNA-seq (RNA) analyses. iPSCs indicated by filled cells have both methylation and RNA-seq data, while those indicated by outlines only have RNA-seq data. B) Dendrogram showing clustering of genome-wide methylation data of fibroblast samples from this study (color-coded) with data from 62 previously published fibroblast samples (grey) showing that fibroblasts do not cluster by genetic background. C) Dendrogram showing clustering at 65 SNPs present on the methylation arrays showing that twins cluster together based on genetic information. D) Hierarchical clustering and heat map of correlation of genome-wide methylation patterns of iPSC samples showing clustering by subject (genetic background), clone and passage (colored based on rectangle shades in 1A). E) Hierarchical clustering and heat map of methylation levels at 3,270 CpGs that have been shown to distinguish pluripotent and somatic cell types and also passed QC in our analysis. The fibroblasts (labeled black in passage annotation, six left most columns) randomly cluster whereas iPSC cluster by genetic background, clone and passage.