
Figure 3. Methylation variation predictor classification has functional significance (see also Tables S1B, S2, S3B, S4, and Figure S3).
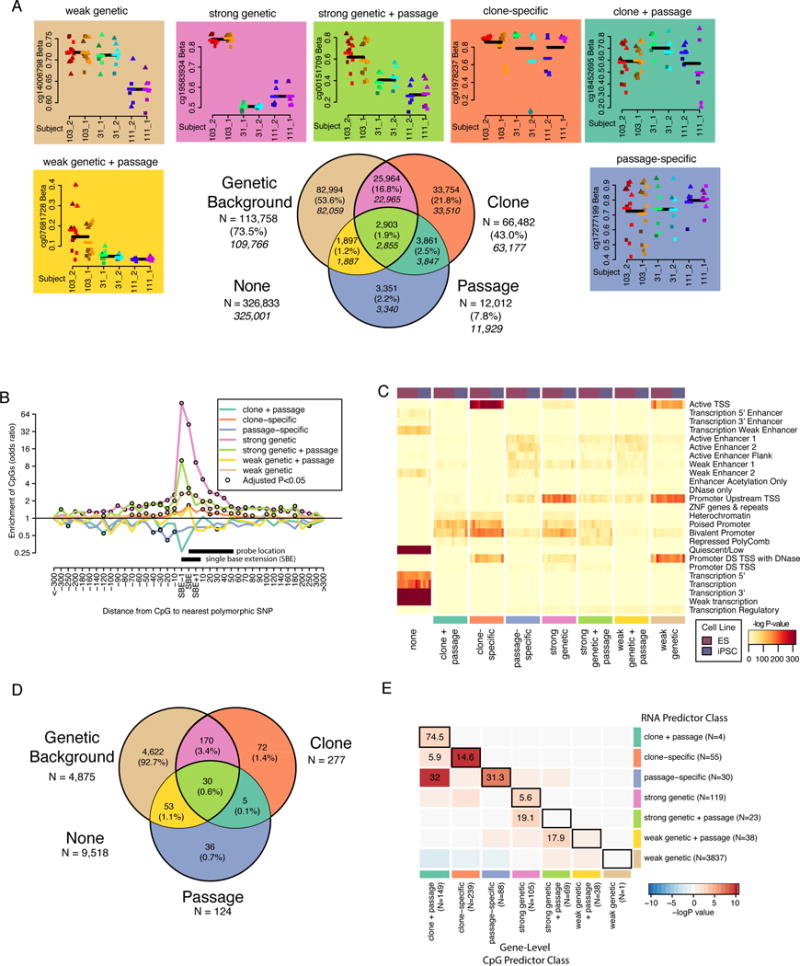
A) Venn diagram showing the overlap of CpG sites associated with genetic background, clone, and passage by ANOVA (FDR < 0.05). Percentages are of the total number of CpGs associated with one or more factor and the italicized numbers indicate the number of CpGs in each group after removal of SBE sites. Plots above and next to the Venn diagram show examples of CpGs that fall into each of the seven categories of the Venn diagram and are colored according to their classification. Within each plot, points are colored according to clone and shapes indicate passage (circle = P5, square = P9, triangle = P20). Black lines indicate the mean of all samples with the same genetic background and colored lines indicate mean of all samples from the same individual. B) Line plot showing odds ratios (OR) of the relationship between a CpG being associated with genetic background and harboring a polymorphic genetic variant at a given distance from the probe for each CpG predictor class from Figure 2A. CpGs are grouped according to distance from SBE site (e.g. −10 includes −2 to −10 and 10 includes +2 to +10). Open black circles indicate that the association was significant at FDR < 0.05. X-axis indicates distance from SBE site. Y-axis is on a log scale. Black bars indicate the position of the assay probe or bases considered to be SBE variants. C) Heat maps showing enrichment –log P-value for hypergeometric association between ROADMAP regulatory regions (25 states) in 8 ES and 5 iPSC reference epigenomes and CpG sites associated with each predictor classification. D) Venn diagram showing the number of genes associated with each RNA predictor class by ANOVA (FDR < 0.01). E) Heatmap showing OR’s for the overlap between gene-level CpG predictor class (columns) and RNA predictor class (rows). Black boxes surround comparisons where the same predictor classification group was compared between methylation and gene expression. Cells are colored according to −logP-value. Inf corresponds to “infinite” and reflects a positive association when an OR cannot be calculated due to a missing cell value.