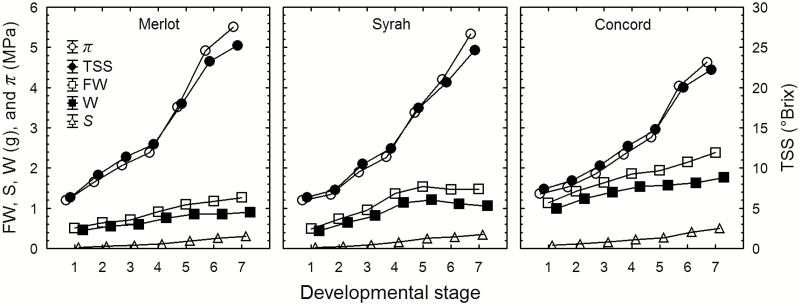
Fig. 1.
Changes in berry total soluble solids (TSS, closed circles), osmotic pressure (π, open circles), fresh weight (FW, open squares), water content (W, closed squares), and solute content per berry (S, open triangles) of Merlot, Syrah, and Concord grape berries at successive developmental stages (1=green hard; 2=green soft; 3=blush/pink; 4=red/purple; 5=blue; 6=ripe; 7=overripe). Values are means±SE where SE>symbol size (n=25).

