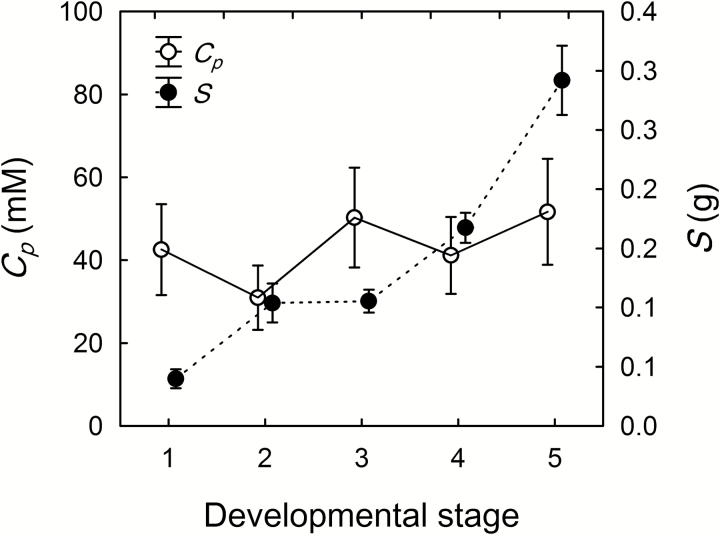
Fig. 5.
Changes in sucrose concentration (Cp, open circles) in the phloem sap collected from grape berry pedicels, and solute content (S, closed circles) of the corresponding berries at successive developmental stages (1=green hard; 2=green soft; 3=blush/pink; 4=red/purple; 5=blue). Values for three Vitis genotypes (Merlot, Syrah, and Concord) were pooled because they did not differ significantly (P=0.31). Values are means±SE (n≥15, P=0.64 for Cp, P<0.001 for S).

