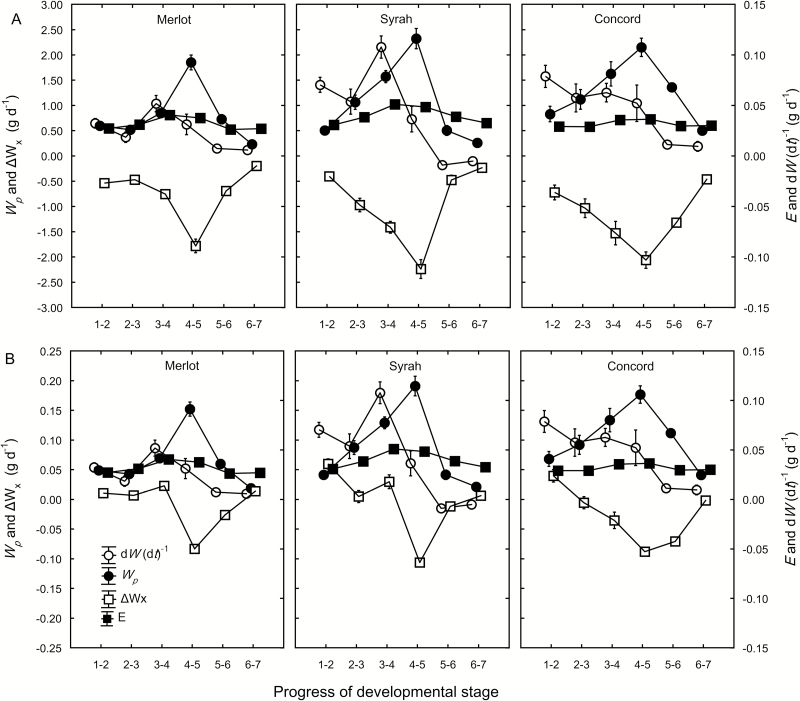
Fig. 6.
Rates of berry water accumulation [dW (dt)–1, open circles], phloem water inflow (Wp, closed circles), net xylem flow (ΔWx, open squares), and berry transpiration (E, closed squares) of Merlot, Syrah, and Concord grapes between successive developmental stages (1=green hard; 2=green soft; 3=blush/pink; 4=red/purple; 5=blue; 6=ripe; 7=overripe). Wp and ΔWx were estimated using a fruit growth model from measured E, berry weight, and solute concentration, and two different phloem sap sugar concentrations that were (A) measured in pedicel phloem sap or (B) the average for transport phloem reported in Jensen et al. (2013). Note the scale difference for Wp and ΔWx compared with E and dW (dt)–1 in both A and B, and also the scale difference for the left y-axis between A and B. Values are means±SE where SE>symbol size (n=5, 10 berries per replicate).

