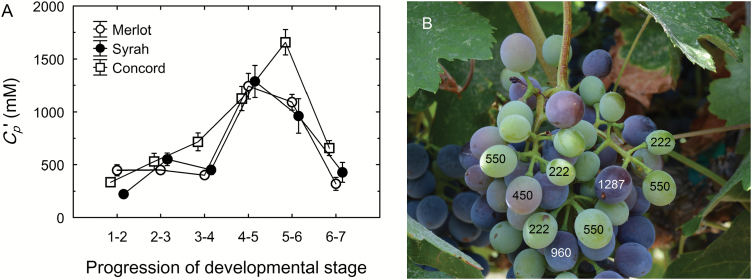
Fig. 7.
Hypothetical sucrose concentration (Cp’) of the pedicel phloem sap as estimated from the fruit growth model for the scenario that all phloem-imported water is used for berry volume growth and transpiration (i.e. no net xylem flow between berry and pedicel). (A) Changes in Cp’ of Merlot (open circles), Syrah (closed circles), and Concord (open squares) grapes throughout berry ripening (1=green hard; 2=green soft; 3=blush/pink; 4=red/purple; 5=blue; 6=ripe; 7=overripe). Values are means±SE where SE>symbol size (n=5). (B) Example of asynchronous ripening of berries on a single Syrah cluster at veraison. Numbers on the berries indicate the estimated Cp’ for those berries. Note the variation in developmental stages of neighboring berries and the large discrepancy in Cp’ for pedicels connected at the same rachis branching point.

