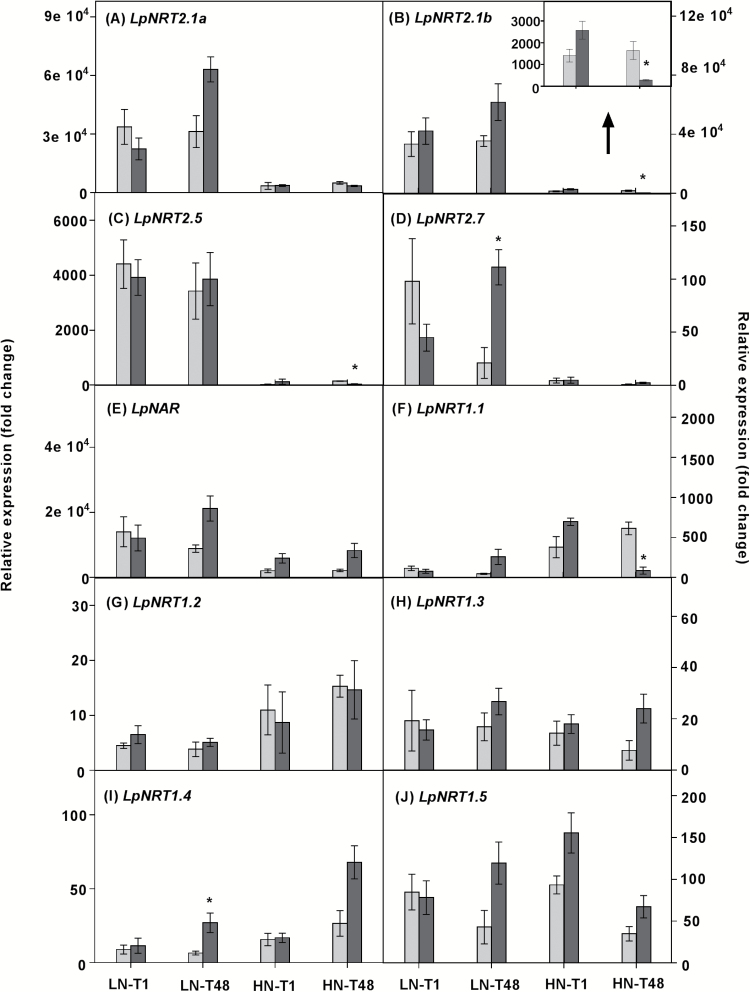
Fig. 4.
Expression of putative low- and high-affinity (LpNRT1, LpNRT2, and LpNAR) NO3– transporter genes in roots of L.perenne. Plants were grown at either 0.05 mM (LN) or 5 mM (HN) NO3–, and then defoliated (or left intact). The expression level of LpNRT2.1b in HN roots is shown in the inserted bar graph in (B). Each data point is normalized against the reference genes eEF-1α and GAPDH. Values are means ±SE (n=3 pools of five plants each). Means were tested for significance using a two-tailed t-test. An asterisk denotes significantly different means between intact plants (grey bars) and defoliated plants (black bars) at P<0.05.

