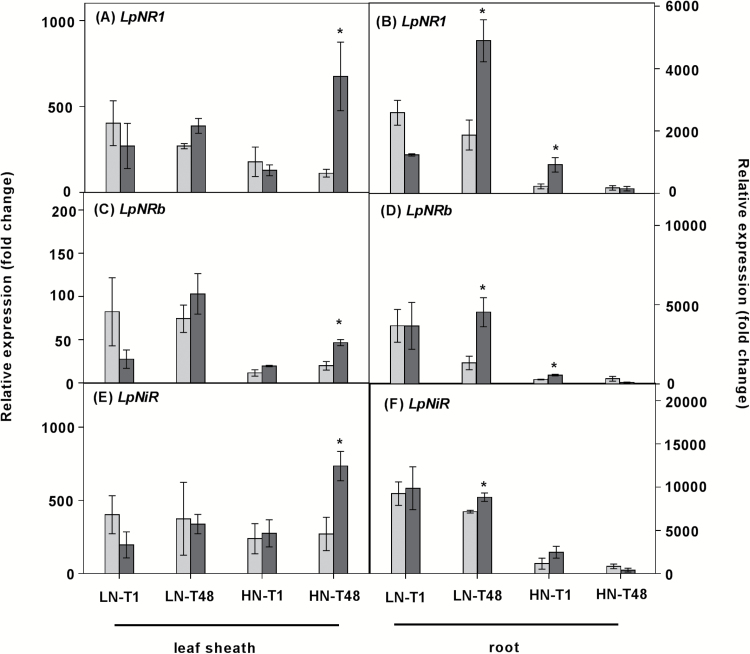
Fig. 5.
Expression of putative nitrate reductase (LpNR) and nitrite reductase (LpNiR) genes in plants. Plants were grown at either 0.05 mM (LN) or 5 mM (HN) NO3–, and then defoliated (or left intact). Each data point is normalized against the reference genes eEF-1α and GAPDH. Values are means ±SE (n=3 pools of five plants each). Means were tested for significance using a two-tailed t-test. An asterisk denotes significantly different means between intact plants (grey bars) and defoliated plants (black bars) at P<0.05.

