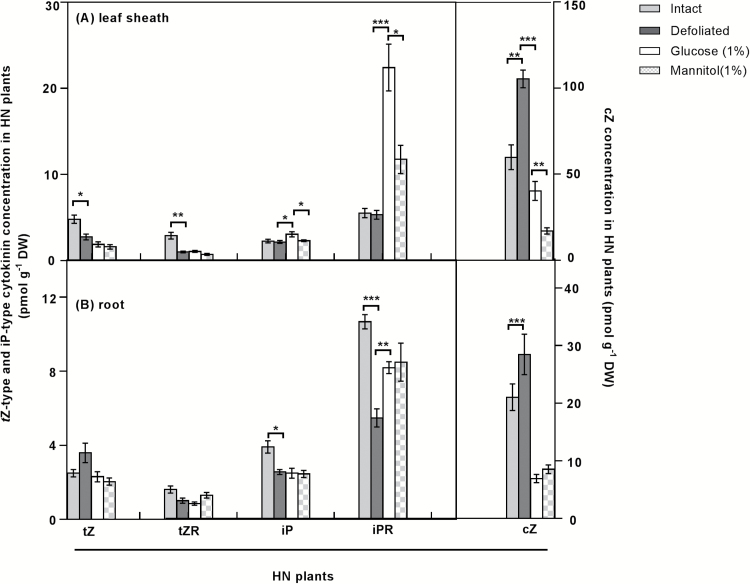
Fig. 7.
Cytokinin concentrations in high N (HN) roots and leaf sheaths 48 h after defoliation. Values are means ±SE (n=5 pools of five plants each). Asterisks denote significantly different means between intact plants (grey bars) and defoliated plants (black bars), or between defoliated plants (black bars) and defoliated plants supplemented with 1% glucose (white bars) or 1% mannitol (hatched bars) (*P<0.05, **P<0.01, ***P<0.001). Means were tested for significance using a two-tailed t-test.

