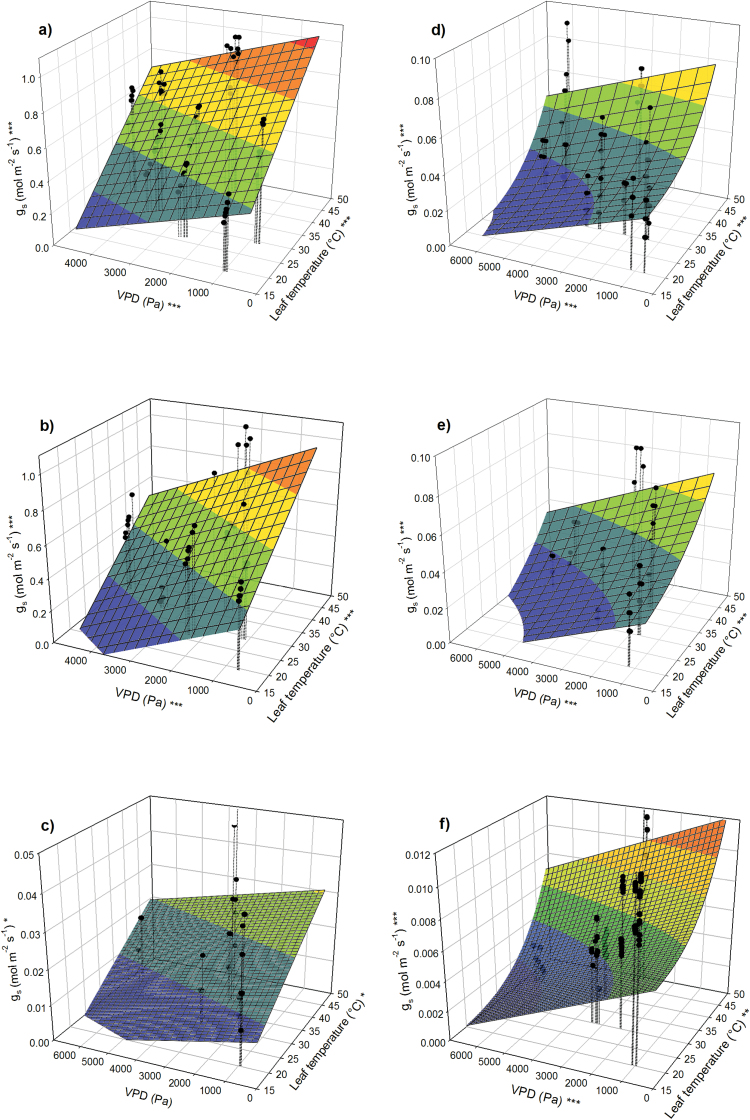
Fig. 1.
Stomatal conductance (gs) of poplar (left panels) and loblolly pine (right panels) and its dependence on Tl and VPD. Plants were measured in high soil moisture conditions and (a, d) ambient [CO2] or (b, e) elevated [CO2]. (c, f) Measurements made on drought-stressed trees at ambient [CO2]. Linear regression was used to fit the data for poplar and non-linear regression was used for loblolly pine. Asterisks at the z-axis label indicate overall significance of the model; asterisks at the x-and y-axes indicate significance of the respective parameters (*P < 0.05; **P < 0.01; ***P < 0.001).

