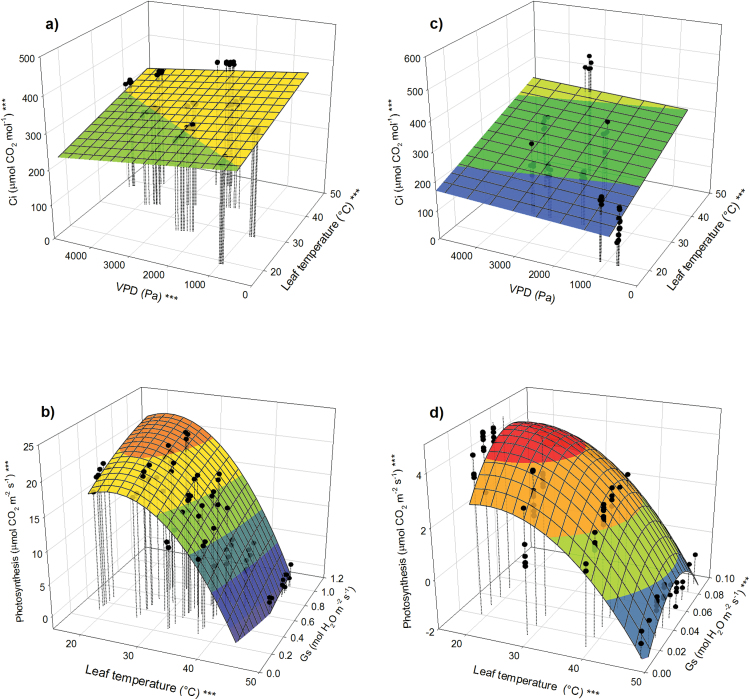
Fig. 3.
(a, c) Relationship between Ci, Tl, and VPD for poplar (left panels) and loblolly pine (right panels). (b, d) Relationship between Asat, Tl, and gs. Asterisks at the z-axis label indicate overall significance of the model; asterisks at the x- and y-axes indicate significance of the respective parameters (*P < 0.05; **P < 0.01; ***P < 0.001).

