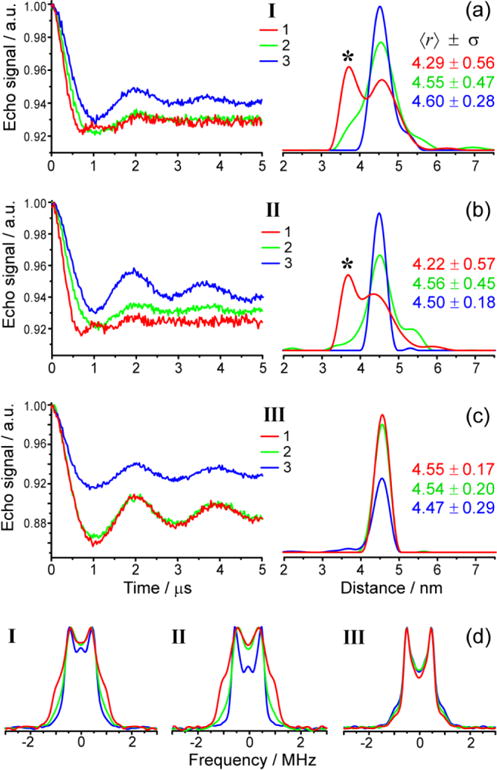
Figure 3.

W-band DEER distance measurements on dsDNAs I (a), II (b) and III (c) obtained at the three pump/probe setups (1,2,3) shown in Figure 2a. Left plots show background-corrected DEER traces; right plots show the corresponding apparent distance distributions (Tikhonov regularization parameter 100). The color codes for all traces correspond to those for pump/probe setups shown in Figure 2. Asterisks mark the “double-frequency peak”, corresponding to the parallel component of the Pake doublet. The mean distances 〈r〉 and standard deviations σ are given in nm for each apparent distance distribution. (d) Frequency-domain dipolar spectra of I–III corresponding to data shown in (a)–(c).
