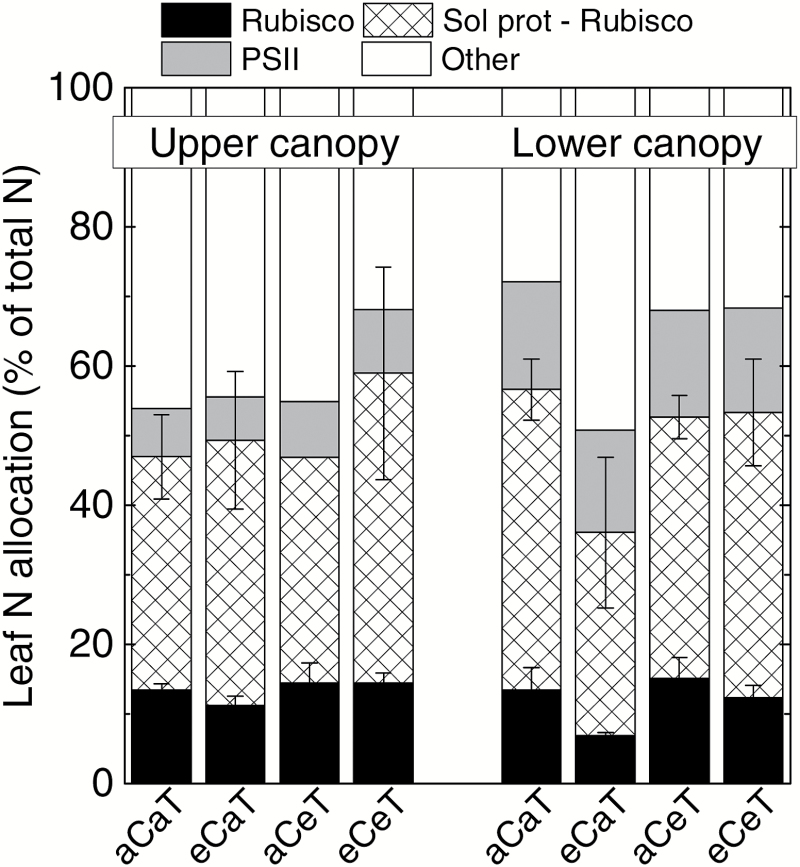
Fig. 4.
Leaf nitrogen allocation of E. globulus in trees grown at ambient (aC) or elevated (eC) atmospheric [CO2], and at ambient (aT) or elevated (eT) air temperature. Values represent averages of 2–3 biological replicates ±SE (n=3 except for eCaT, where n=2). The N percentages were calculated using data in Table 2 and Fig. 1. Other details are as described in the Materials and Methods.

