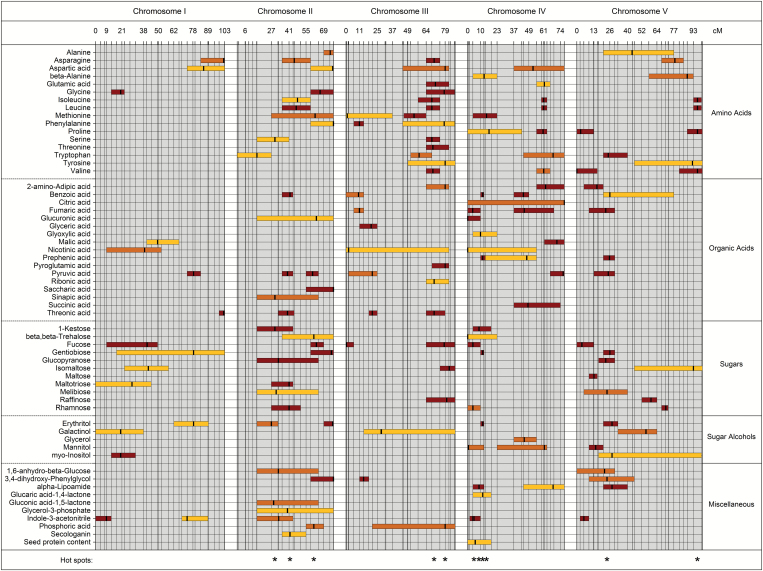
Fig. 1.
Distribution of mQTLs for metabolites of known chemical structure. Chromosomal locations of significant mQTLs for the 58 metabolites of known chemical structure and the seed protein content are indicated by boxes representing the 1.5-LOD QTL support intervals. Vertical black lines within the boxes indicate the apices of the corresponding LOD curves. The mQTLs are color-coded according to their significance [threshold at alpha of 0.05 (yellow), 0.01 (orange), 0.001 (red)] derived from permutation results of the genome-wide maximum LOD scores. Vertical lines represent marker positions. For a subset, their approximate distance in centiMorgans is indicated. Asterisks at the bottom correspond to the position of identified mQTL hotspots.

