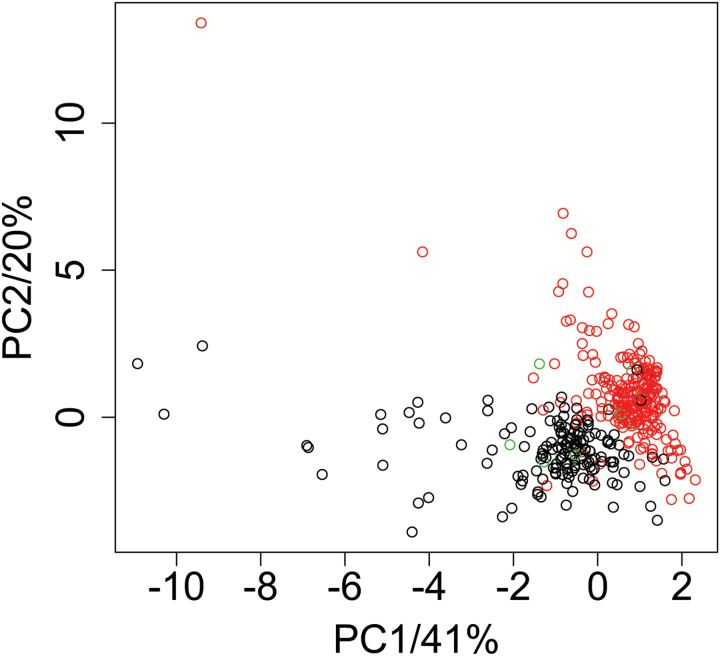
Fig. 3.
Principal component analysis of metabolite data. Score plot of the first two principal components PC1 and PC2 explaining 41% and 20% of variance of the data set, respectively. Samples were colored according to the genotype information on chromosome IV/marker: ‘MASC05042’ (12.90 cM). Black, red, and green circles correspond to Col-0, C24, and heterozygous alleles, respectively. Data were normalized, Pareto scaled, and mean centered prior to the calculation of the principal components.

