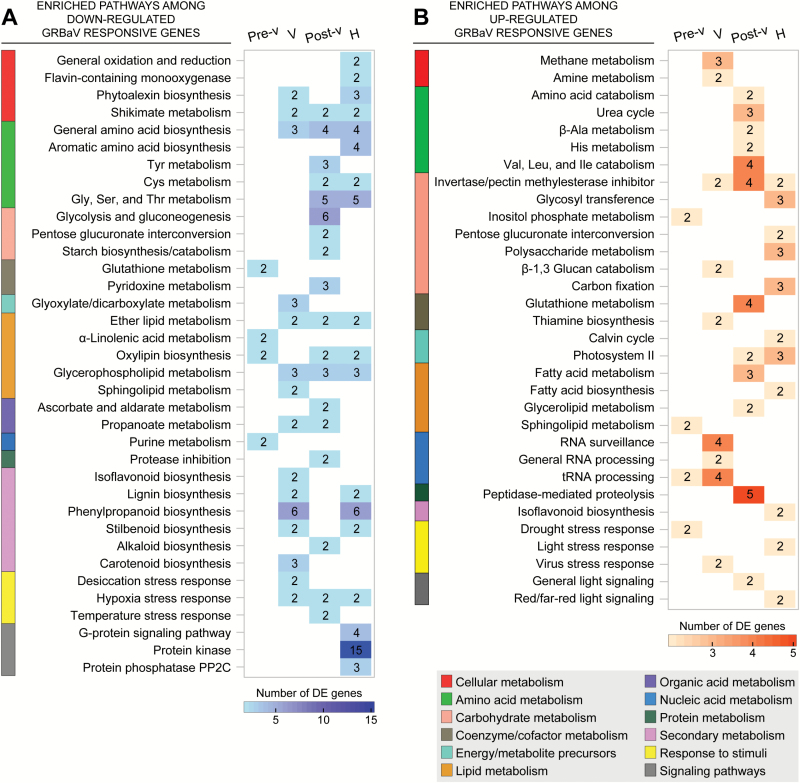
Fig. 2.
Grape metabolic pathways suppressed or activated in response to GRBaV infections of Zinfandel berries at four ripening stages. The graph depicts enriched (P≤0.05) pathways among significantly (P≤0.05) down-regulated (A) and up-regulated (B) grape genes in response to GRBaV infections of ripening berries from two vineyards. Color intensities in the heat map correlate with the number of differentially expressed (DE) genes in each pathway. Blank spaces represent pathways that were not significantly enriched at a particular stage or that did not include DE genes. Pre-v, pre-véraison; V, véraison; Post-v, post-véraison; H, harvest.

