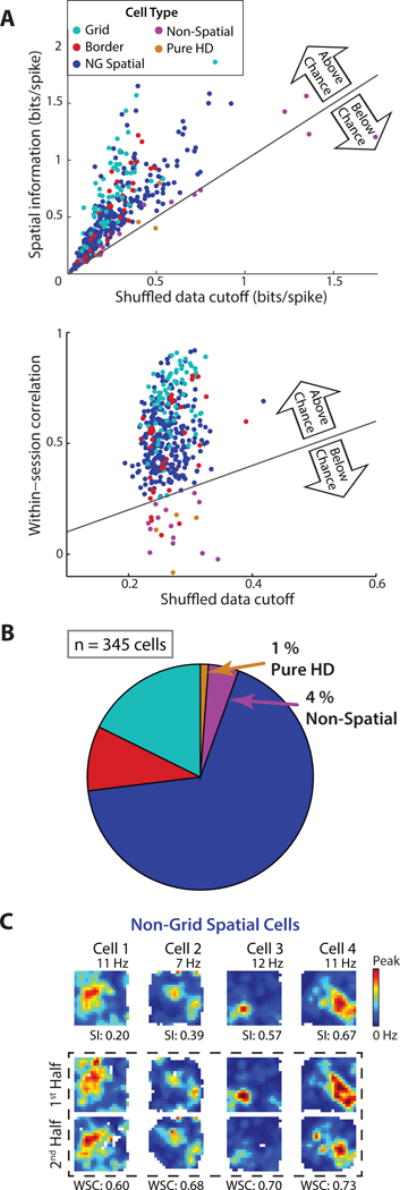
Figure 1. Approximately 95 % of cells in mEC superficial layers were identified as spatial.

(A) Each cell’s spatial information (top) and within-session spatial correlation (bottom) is plotted against the respective 95th percentile value from the same cell’s shuffled data (‘cutoff’). Approximately 95 % of mEC cells were above the cutoffs for both spatial information and spatial correlation. (B) Of the spatial cells, 17.7 % had significant grid scores and 9.3 % had significant border scores. The remaining 67.5 % did not have either of these specialized firing patterns and are thus referred to as ‘non-grid spatial cells’. (C) Rate maps of four cells that were identified as non-grid spatial. Firing rates are color-coded according to the scale bar on the right. For each rate map, the peak rate is noted above and the spatial information (SI) value is noted below. In the box marked by the stippled line, rate maps from the four cells are shown separately for the first and second half of the 10-min behavioral session. The within-session correlation (WSC) between the two half-session rate maps is noted below each pair of rate maps. See Figure S1 for histology and cluster quality metrics and Figure S2 for comparison to previously used classification criteria for mEC cells. Table S1 shows that all cell types were identified in similar proportions across animals.
