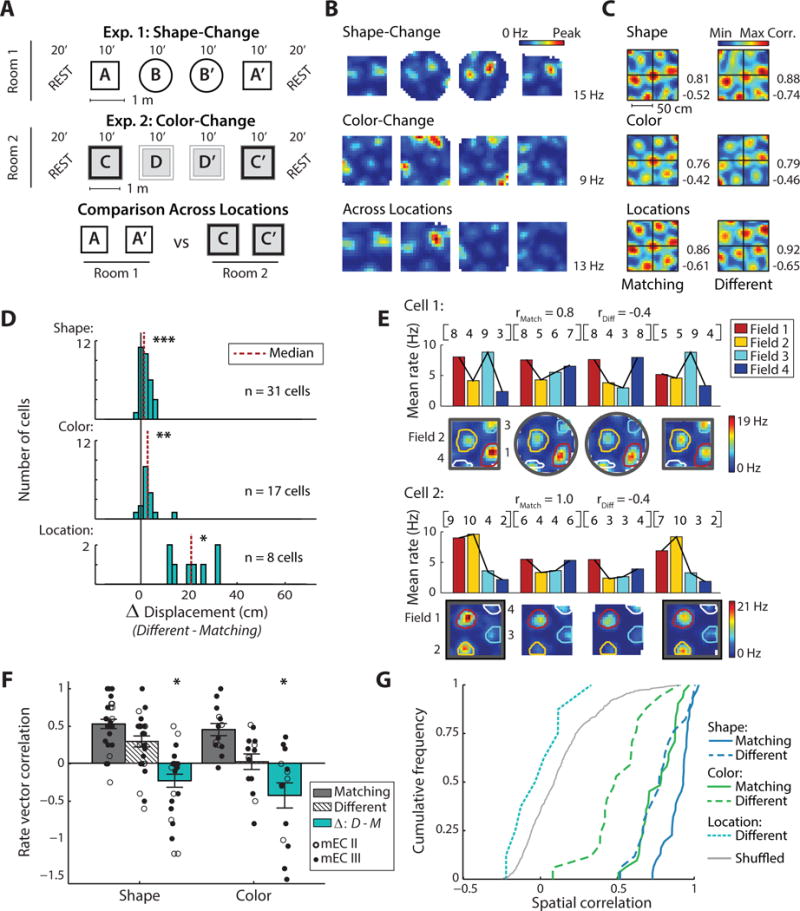
Figure 2. For manipulations of box shape or box color, grid cell maps showed only minor shifts in their spatial location, but substantial redistributions of firing rates.

(A) Schematic of the experimental paradigms. (B) Firing rate maps of an example grid cell that was recorded across all conditions. The peak rate of the cell across each set of four sessions is indicated to the right. (C) To measure the spatial stability between sessions, spatial cross-correlations were computed for the rate maps of each grid cell. For the example cell in (B), spatial cross-correlation maps are shown across matching conditions (left column) and across different shapes (right, top), colors (right, middle), and locations (right, bottom). Cross-correlation matrices are scaled from the minimum to the maximum correlation coefficient (noted to the right, blue to red). The displacement of the central peak from the origin measures the extent of the shift in the grid pattern. (D) Displacement from the origin when manipulating box shape, color, or location. For each comparison, the shift between repetitions of matching conditions was subtracted from the shift between sessions in different conditions (Δ displacement). Grid cells exhibited a significant displacement for shape, color, and location changes (Wilcoxon signed-rank matching vs different shape: z = 3.8, p < 0.001; different color: z = 3.3, p < 0.01; different location: z = 2.5, p < 0.05), although the median increase was only 1.3 cm for the shape change and 2.8 cm for the color change. (E) To further evaluate the overall firing profile of grid fields, we considered coordinated rate changes across grid fields and, for each grid cell, generated firing rate vectors (RVs) in which each element is the mean rate of a grid field. Rate maps and the resulting RVs (row vectors and bar graphs) are shown for two example grid cells in the shape-change and color-change paradigms. The average Spearman correlation of RVs across matching and different conditions is noted for both examples. Note that the vector is similar between matching conditions but changes across different conditions. (F) For grid cells with at least three fields (shape: n = 27; color: n = 14), rate vector correlation coefficients between matching environments and different environments are shown, along with the mean ± SEM. In addition, the Δ between the correlation coefficient in matching and different environments is plotted. RVs are more correlated between matching boxes compared to boxes with different shapes or different colors (Wilcoxon signed-rank matching vs different shape: z = −2.4, p < 0.05; different color: z = −2.0, p < 0.05). (G) Cumulative density functions (CDFs) of the spatial correlation between pairs of grid cell rate maps. Pairs were from recordings of the same cell in either matching or in different environments, and cell identity was permutated to generate chance correlations. Compared to correlations between rate maps in matching environments, spatial correlations decreased in response to manipulations of environment shape or color (Wilcoxon signed-rank matching vs different shape: z = −4.7, p < 0.001; different color: z = −3.6, p < 0.001). When comparing across different locations, spatial correlations were not different from shuffled values (Mann-Whitney U different location vs shuffled: z = −1.4, n.s.). * p < 0.05, ** p < 0.01, *** p < 0.001. See Figure S3 for corresponding data from individual animals and Figure S4 for corresponding hippocampal CA1 place cell data.
