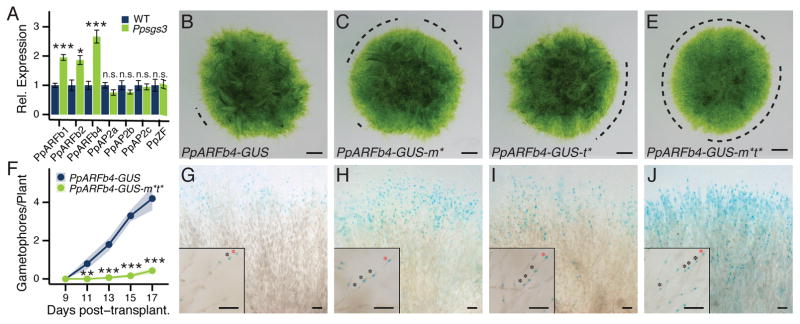
Figure 2. The Ppsgs3 phenotype reflects misregulation of tasiARF-targeted ARFs at the protonema edge.
(A) qRT-PCR values for tasiRNA targets in Ppsgs3 (mean ± SE, n ≥3) normalized to wild type. *P < 0.05, ***P < 0.001, Student’s t test. (B–E) Caulonema occurrence on 15 day-old PpARFb4-GUS (B), PpARFb4-GUS-m* (C), PpARFb4-GUS-t* (D), and PpARFb4-GUS-m*t* (E) plants. Dotted lines, protonemal regions lacking caulonema. Scalebar, 1mm. (F) Gametophore numbers (mean ± SE, n ≥10) on PpARFb4-GUS and PpARFb4-GUS-m*t* plants. **P < 0.01, ***P < 0.001, Student’s t test. (G) PpARFb4-GUS activity in 1–3 cells at the tips of a small random (Ljung-Box test, P = 0.19) subset of chloronemal filaments. (H–J) Expanded reporter activity in PpARFb4-GUS-m* (H), PpARFb4-GUS-t* (I), and PpARFb4-GUS-m*t* (J). The latter reflects the broad activity of the PpARFb4 promoter. Insets show isolated filaments; asterisks, cells expressing PpARFb4-GUS; red asterisks, tip cells. Scalebar, 0.1mm. See also Figure S4.

