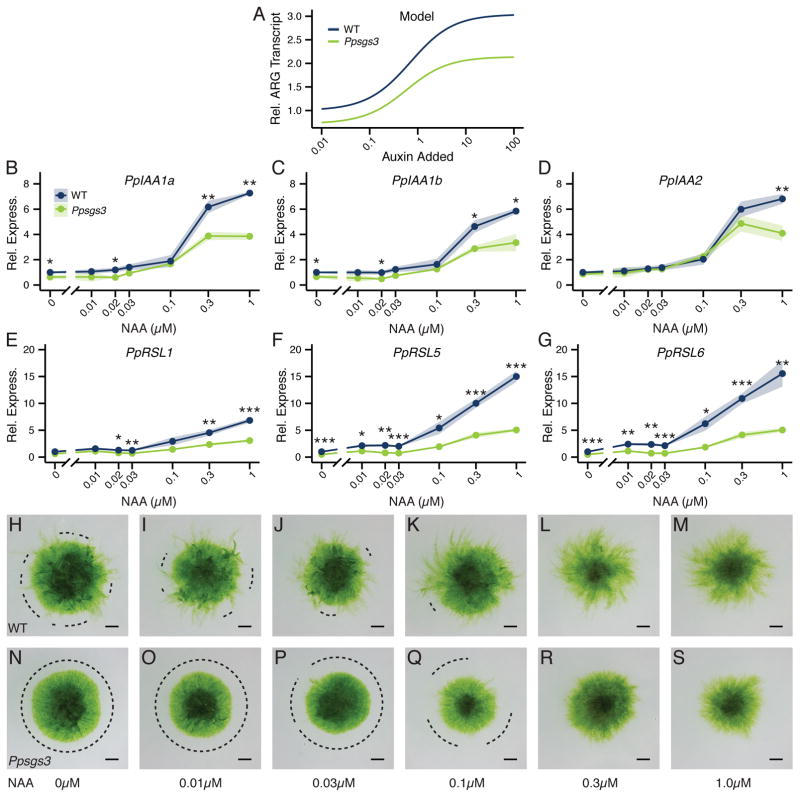
Figure 5. Perturbation of tasiRNA biogenesis dampens auxin sensitivity.
(A) Model predictions for steady-state ARG transcript levels at increasing auxin concentrations for ‘wild type’ and ‘Ppsgs3’, normalized to ‘wild type’ levels at baseline auxin signaling input. X-axis, value of auxin signaling input added to the baseline level in the model (see Modeling Supplement). (B–G) Relative transcript levels (mean ± SE, n ≥3), normalized to wild type grown on media without added NAA, for PpIAA1a (B), PpIAA1b (C), PpIAA2 (D), PpRSL1 (E), PpRSL5 (F), and PpRSL6 (G) in 15 day-old wild type and Ppsgs3 plants grown on increasing NAA concentrations. *P < 0.05, **P < 0.01, ***P < 0.001, Student’s t test. (H–S) Caulonema occurrence on15 day-old wild type (H–M) and Ppsgs3 (N–S) plants grown on media supplemented with increasing concentrations of NAA. Dotted lines, protonemal regions lacking caulonema. Scalebar, 1 mm.

