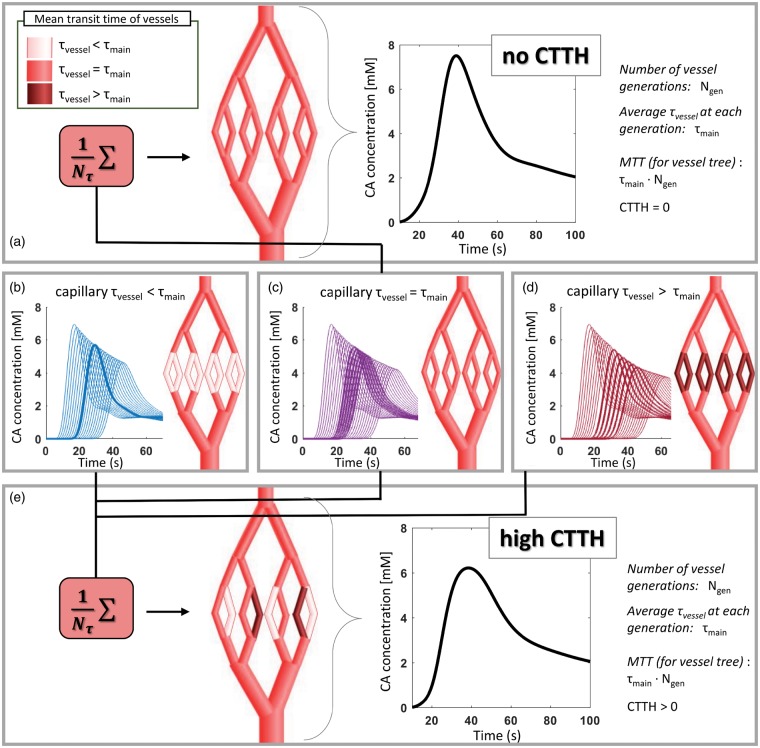
Figure 1.
Schematic representation of implementation of CTTH into the vascular model. To obtain a simulated vessel network with CTTH = 0 (top panel (a)), all vessels in the vessel tree have the same mean transit time (), indicated by the same shade of red in the illustrated vessel tree. The resulting concentration time curve for the whole vessel tree is shown in the graph. To obtain CTTH > 0, several vessel trees are generated where in arteries and veins remain constant at , whereas on the capillary levels becomes shorter (shown in light red in (b)) or longer (shown in dark red in (d)) compared to The corresponding concentration time curves for each vessel generation are shown in (b) to (d), where the curves from capillary generations are highlighted with thicker lines. Note that the graphs in (b) to (d) display concentration time curves from vessel trees with vessel generations, whereas the illustrated vessel trees contain only = 8. The vessel trees are then combined with equal weight (=1/, where is number of vessel trees with different capillary , here shown for = 3), as shown in bottom panel (e). The concentration time curve for the resulting vessel tree with high CTTH is shown in the graph (bottom right), where the peak of the curve is wider and lower compared to that of the concentration time curve with no CTTH. Note that the concentration time-curves in (a) and (e) is for illustration only and not used in the simulation as such, as the signal response for each vessel generation is calculated before they are combined.

