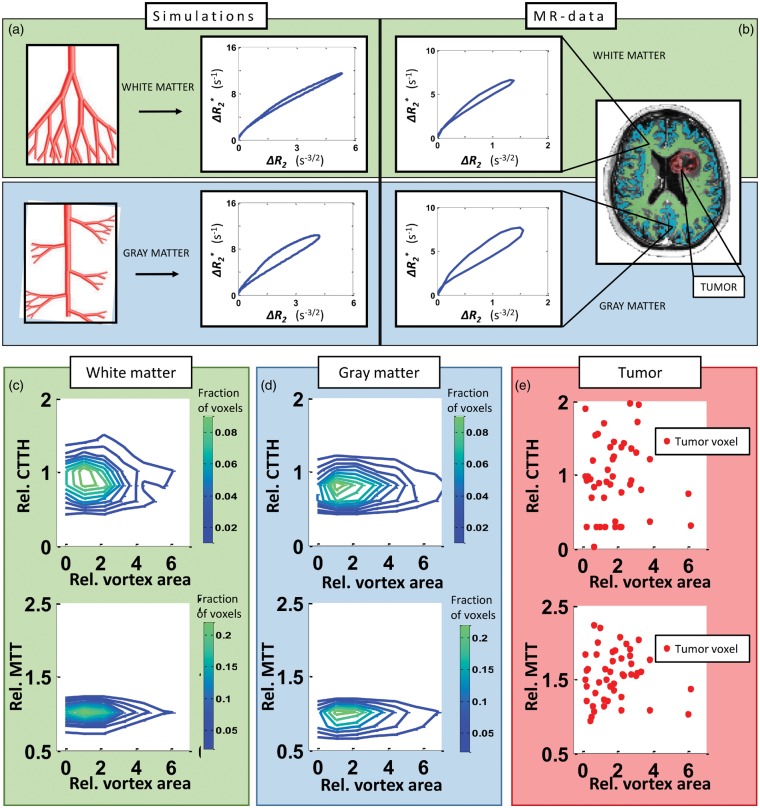
Figure 5.
Vortex area-distribution in tissue types. (a) Simulations of vessel branching associated with white matter produces vortices with a relative small area (top row), compared to vessel branching mimicking gray matter, which gives vortices with a larger area (bottom row). The same GM to WM ratio of the vortex area is found in patient data. (b) A typical vortex from a white matter-voxel (top row) and from a gray matter-voxel (bottom row) is shown. WM- and GM-voxels are identified from maps as shown in MR-image (right) generated from Look-Locker acquisitions. Distribution of relative CTTH-values (top row) and relative MTT-values (bottom row) across relative vortex area in white matter (c), gray matter (d) and tumour (e) in voxels with relative CBV-values from 1.6 to 2.0, in a glioblastoma patient. Green (blue) contour lines denote higher (lower) fraction of voxels. Red dots correspond to single voxels in tumour region identified from contrast enhanced T1-weighted MRI.

