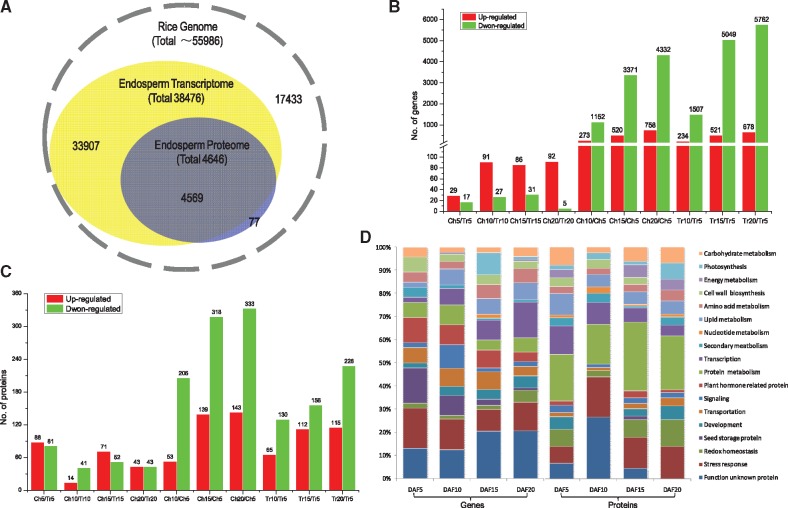
Fig. 2.
Comparison of protein and transcript abundance in developing rice grains. (A) Congruency between the detected transcripts and proteins of rice endosperm. (B) Number of differentially expressed genes in relation to developmental and chalkiness effects (absolute value of log2Ratio ≥1 with probability ≥0.8); Ch5, Ch10, Ch15, and Ch20, chalky part at 5, 10, 15 and 20 days after flowering (DAF); Tr5, Tr10, Tr15 and Tr20, translucent part at 5, 10, 15 and 20 DAF. (C) Number of differentially expressed proteins in relation to developmental and chalkiness (occurence) effects (1.2-fold change with P-value <0.05). (D) Functional classification and distribution of the differentially expressed genes and proteins between the chalky and translucent parts at four time points via the Gene Ontology (GO) database.

