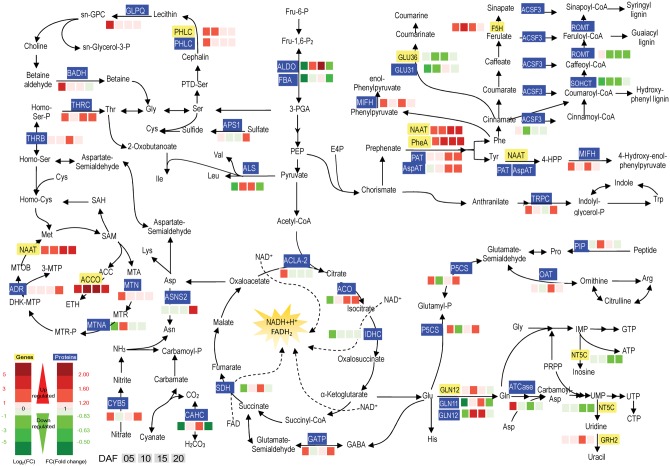
Fig. 5.
Expression patterns of genes and proteins for amino acid metabolism in the upper translucent part and the bottom chalky part of the notched-belly grains. Annotations of genes and proteins are available in Supplementary Tables S4 and S5. Black characters with yellow background are genes, whereas white characters with blue background are proteins. The four squares under the names of genes or proteins indicate abundance change of Ch5/Tr5, Ch10/Tr10, Ch15/Tr15 and Ch20/Tr20, respectively. A red square indicates up-regulation, whereas a green square indicates down-regulation.

