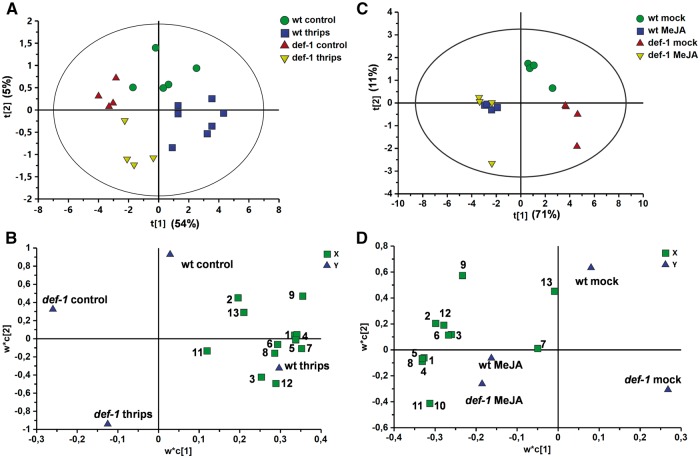
Fig. 6.
PLS-DA of volatile compounds detected in leaf exudates of thrips-infested and non-infested wild-type (wt) and def-1 plants (A and B), and mock-treated and MeJA-treated wild-type (wt) and def-1 plants (C and D) at 12 d from initial treatment. Score plot (A and C) and loading plot (B and D) of the first two principal components (PCs) with the explained variance in parentheses. The second PC was not statistically significant and is only shown for representational purposes. The ellipse in (A) and (C) defines the Hotelling’s T2 confidence region (95%). The numbers in (B) and (D) represent: 1, α-pinene; 2, p-cymene; 3, myrcene; 4, δ-carene; 5, α-phellandrene; 6, α-terpinene; 7, limonene; 8, β-phellandrene; 9, trans-ocimene; 10, γ-terpinene; 11, terpinolene; 12, unknown; and 13, β-caryophyllene.

