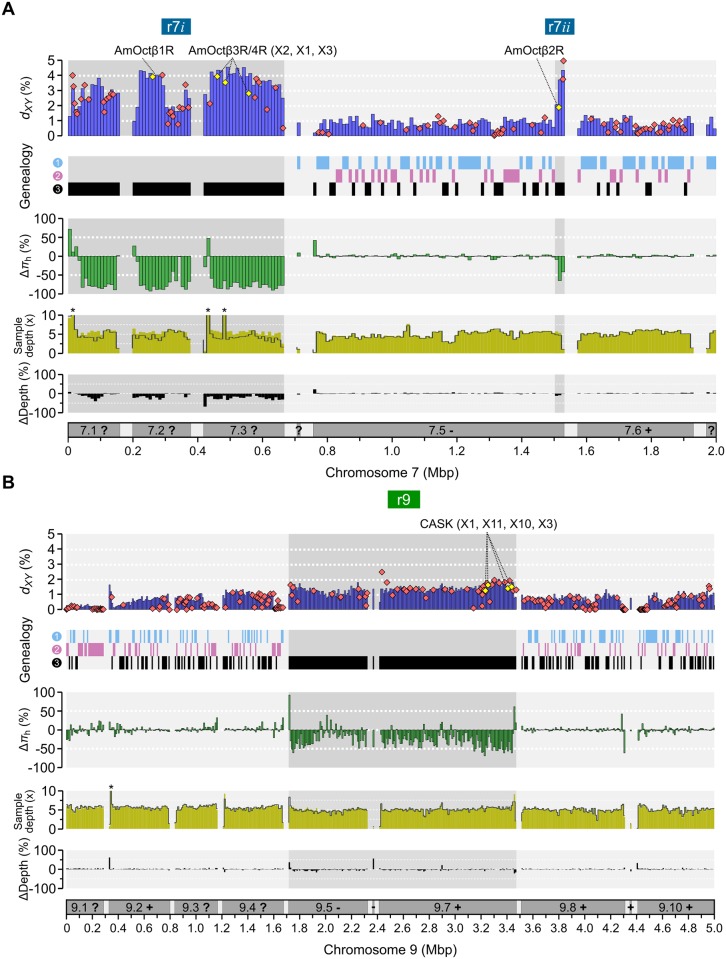
Fig 6. Window-based estimates of divergence and relative genetic diversity between highland and lowland haplotypes.
(A) Divergence and diversity for the r7 region (r7i+r7ii; shaded) on chromosome 7 (10 kbp non-overlapping windows). From the top: i) Average pairwise genetic distances (dXY) between forest highland (r7h) and savannah lowland (r7l) haplotypes; diamond symbols are dXY for genes (centered at gene-body mid-points); yellow diamonds are octopamine receptors; ii) four-way population interrelationships as in Fig 2C and 2D; iii) genetic diversity on r7h relative to r7l; iv) average per-haplotype sample mapping depth for r7h (grey lines) and r7l (yellow bars) with three >10× mapping peaks shared between highland and lowland haplotypes indicated with stars (per-haplotype average coverage 131×, 13× and 13×, respectively); v) the difference in mapping depth after normalizing across the whole chromosome. Scale bar indicate scaffold coordinates and orientation (? = unknown orientation) in the reference genome sequence. (B) The corresponding data for the r9 region. Shared mapping peak at 13× per-haplotype coverage indicated with star.

