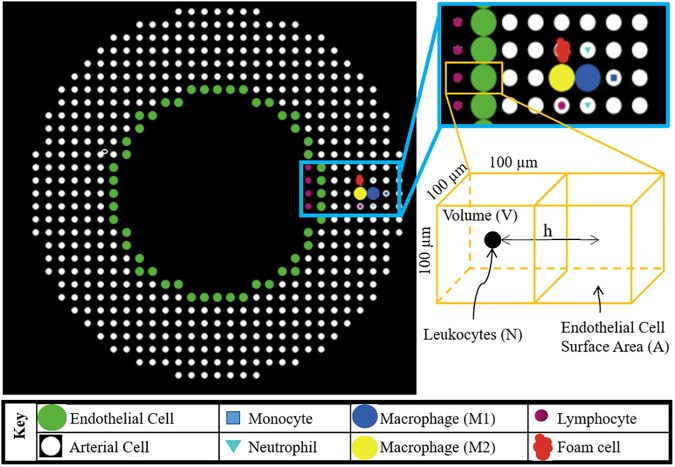
Fig 1. Schematic illustrating the spatial distribution of each type of cell (i.e. agent) in the ABM.
The bottom right schematic represents a luminal and artery wall patch where N is the number of leukocyte agents residing in this luminal patch. Among all leukocytes (N), M is the number that adheres to the endothelial cell surface area (A). V is the patch volume and h is 100μm or the distance between the patch centroids. All these parameters are used to find leukocyte adhesion probability (see Eq 2).

