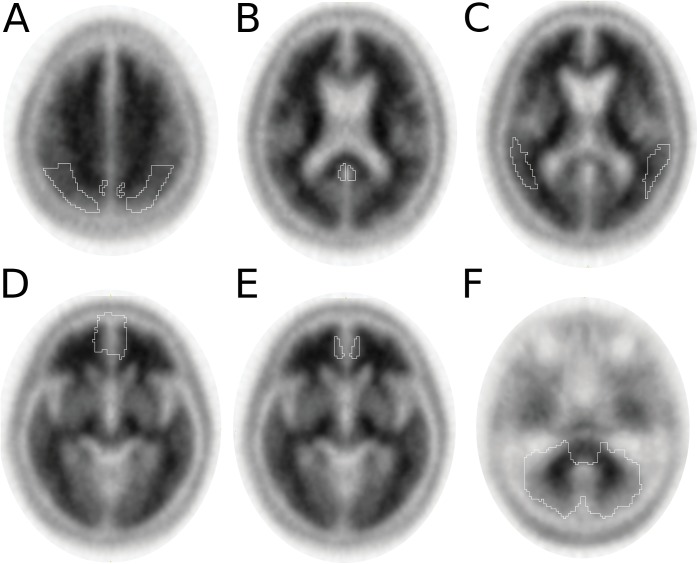
Fig 1. Analyzed regions of interest (ROIs) in the 18F-florbetepir PET scans.
Six individual cortical ROIs and a cerebellum ROI were analyzed for regional 18F-florbetapir binding and to calculate a composite ROI (see Methods). Representative trans-axial images from a Aβ negative (left) and positive (right) study demonstrate each ROI: (A) parietal cortex and precuneus; (B) frontal cortex; (C) anterior and posterior cingulate gyrus; (D) temporal cortex; and (E) cerebellum. Darker regions indicate higher 18F-florbetapir retention.

