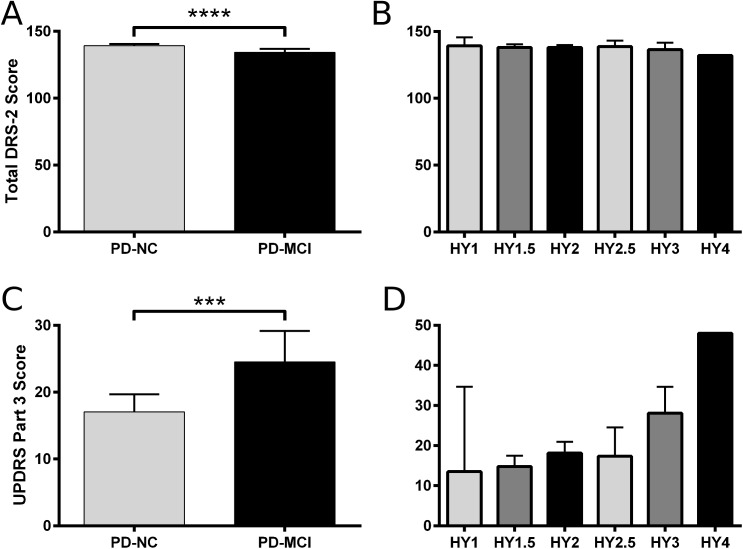
Fig 2. Cognitive and motor characteristics of the study population.
A. Total DRS-2 score was significantly lower in PD-MCI participants (134.3, 131.7 to 136.9) as compared to PD-NC (139.3, 138.1 to 140.6) (t(57) = 4.12, p < 0.001). B. Total DRS-2 score was not significantly different among H&Y stages (F(5,53) = 0.54, p = 0.75). C. UPDRS part 3 score was significantly higher in PD-MCI (24.5, 19.9 to 29.2) as compared to PD-NC (17.1, 14.5 to 19.7) (t(59) = 3.07, p = 0.003). D. UPDRS part 3 score was significantly higher with advanced H&Y stage (1.0: 13.5, 0.2 to 26.8; 1.5: 14.8, 12.4 to 17.1; 2.0: 18.2, 15.5 to 20.9; 2.5: 17.3, 11.8 to 22.9; 3.0: 28.1, 22.3 to 33.9; 4.0: 48) (F(5,55) = 6.57, p < 0.001). There was no association between motor phenotype (TD vs. PIGD) and H&Y stage (data not shown). Data depicted are mean ± 95% C.I. Significance identified by one-way ANOVA and Tukey post-hoc test. *** p < 0.005, **** p < 0.001.

