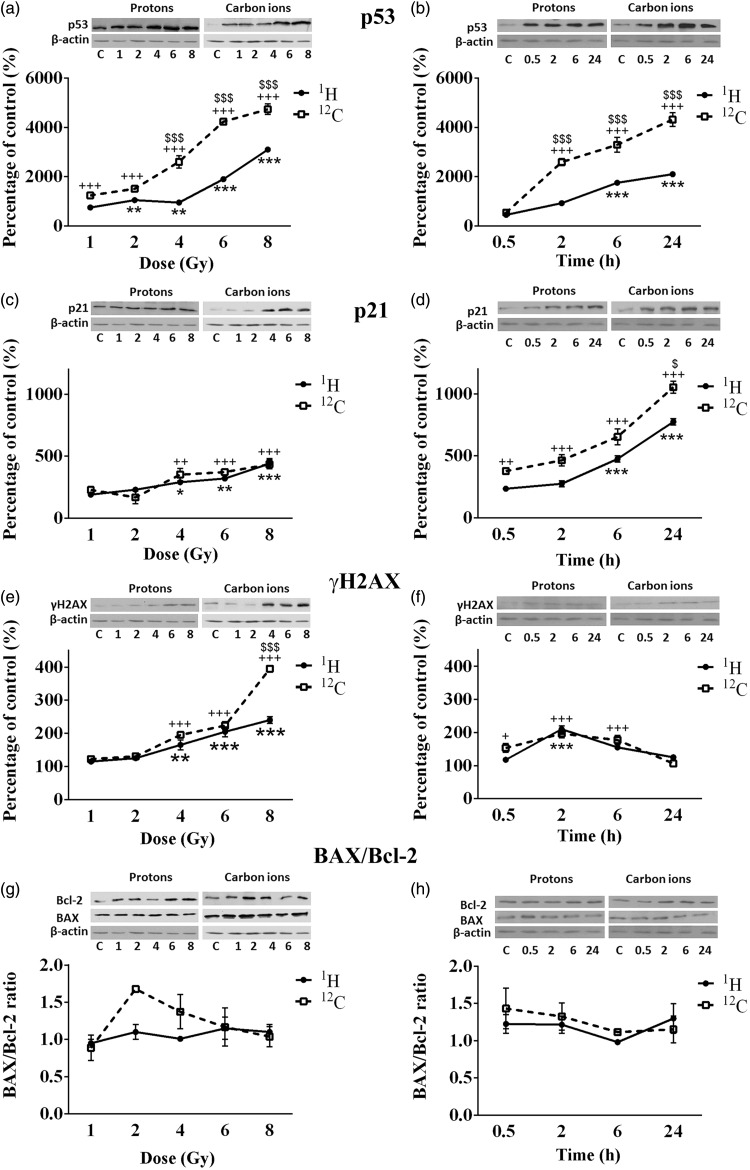
Figure 4.
Changes in levels of p53 (a and b), p21 (c and d), γH2AX (e and f), BAX and Bcl-2 (g and h) in CRL5876 cells. Dose-dependent changes were followed 2 h after irradiations with different doses (1, 2, 4, 6, and 8 Gy) of SOBP protons and carbon ions. Time-dependent changes were followed at four time points (0.5, 2, 6, and 24 h) after irradiations with 4 Gy of SOBP protons and carbon ions. Results are presented as mean ± standard error of mean (SEM).
*Statistical significance SOBP compared with the control, +Statistical significance carbon ions compared with the control, $Statistical significance SOBP versus carbon ions: *,+,$0.01 < P < 0.05; **,++,$$0.001 < P < 0.01; ***,+++,$$$P < 0.001

