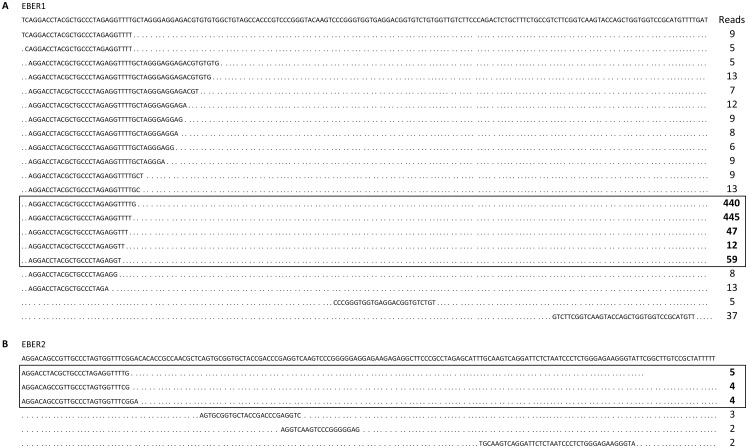
Fig 5. Coverage of small RNA reads originating from EBER RNA1 (A) and EBER RNA2 (B).
The top line in both panels shows the full-length sequence of the respective EBER RNA. The nucleotide sequence and read count for each small RNA is indicated. The most highly expressed small RNA fraction is shown boxed in both panels. Only sequences with a read count ≥ 5 (EBER1) or ≥ 2 (EBER2) are displayed.

