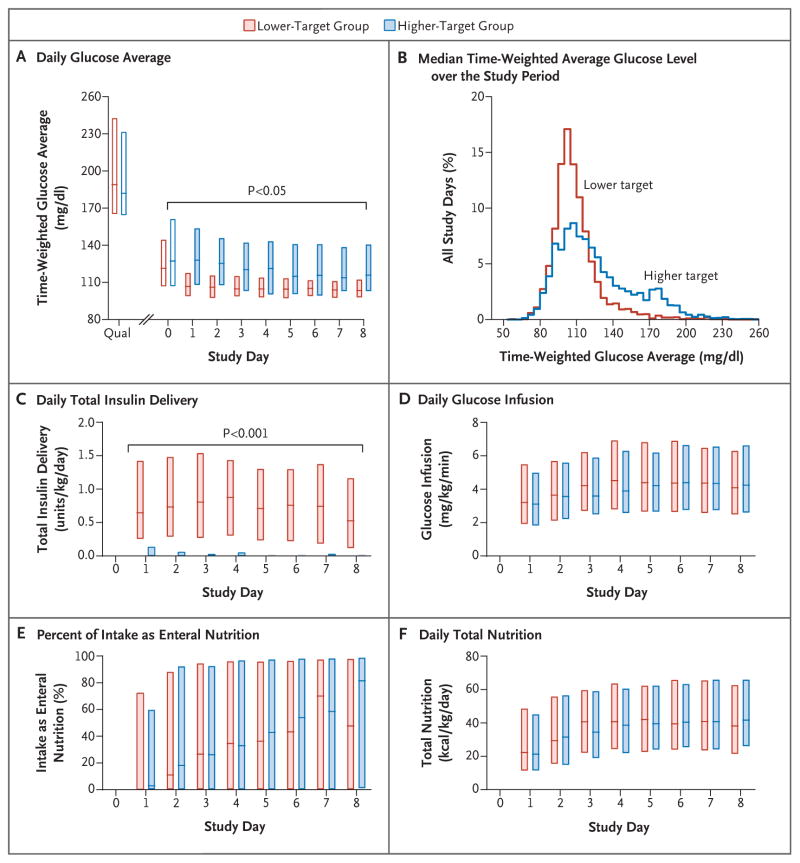
Figure 2. Glucose, Insulin, and Nutrition Levels, According to Study Group.
Daily data are for the first 8 study days (the median duration of stay in the intensive care unit). Panel A shows time-weighted glucose averages obtained from a linear interpolation of the glucose values that were used to administer the tight-glycemic-control protocol. Open bars indicate either the value used to qualify for the study (Qual) or a partial study day (day 0, the day of randomization), and shaded bars indicate full study days (midnight to 11:59 p.m.). To convert values for glucose to millimoles per liter, multiply by 0.05551. Panel B shows the median time-weighted average glucose level over the entire study period. Panel C shows the daily total insulin delivery, Panel D the daily glucose-infusion rates, Panel E the daily percentage of total nutrition given enterally, and Panel F the daily total nutrition. In each panel, the boxes represent the interquartile range, and the horizontal lines the median. P values for the comparison between groups were calculated with the use of Wilcoxon rank-sum tests (without adjustment for multiple comparisons).

