
Figure 3.
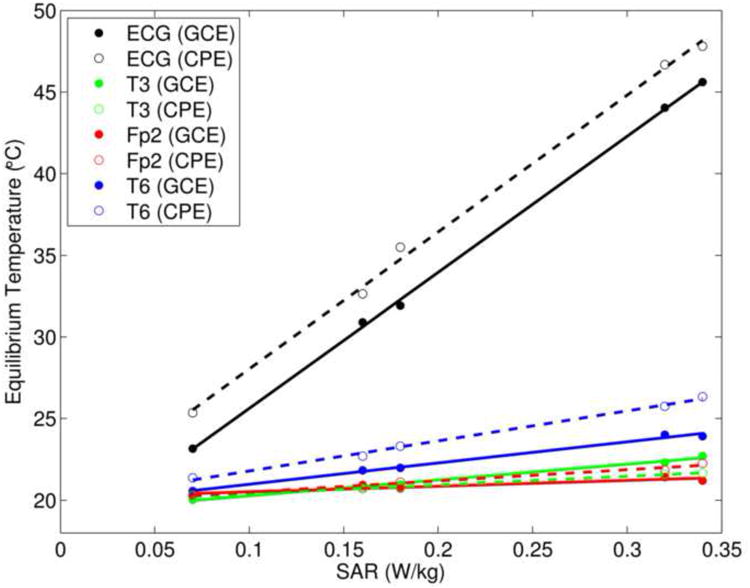
For the short wire configuration in Experiment 1, the equilibrium temperature at each electrode versus the specific absorption rate (SAR) of each pulse sequence used in this study (see Table 1). The data for GCEs and CPEs are shown with filled and open circles, respectively, and the corresponding straight-line fits are shown with solid and dashed lines.