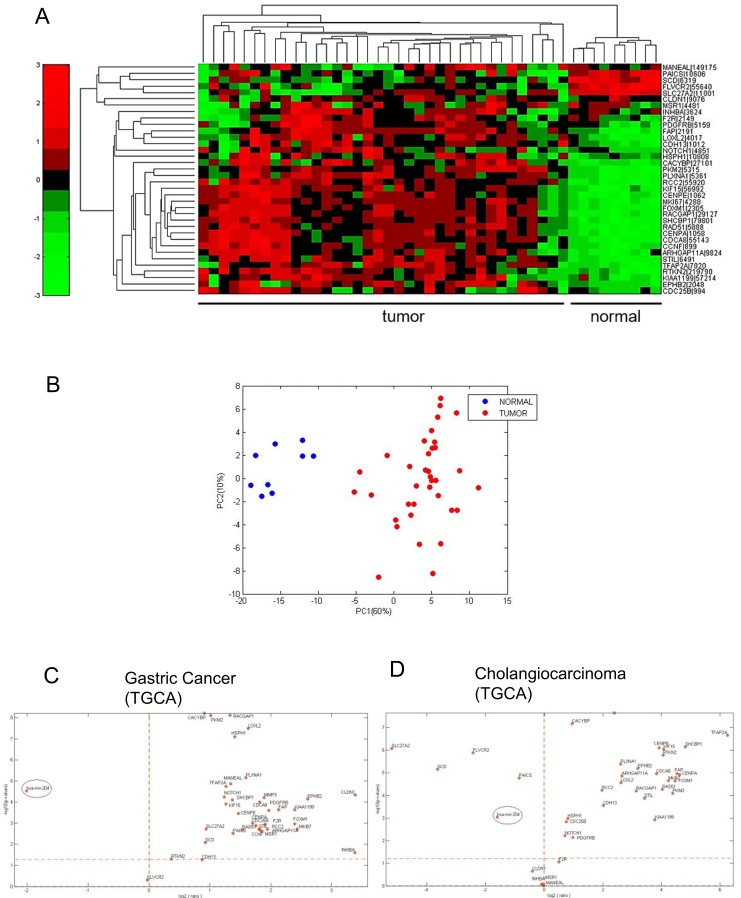
Figure 4. The miR-204 target gene signature is enriched in cholangiocarcinoma tissues.
A. Heatmap. Unsupervised hierarchical clustering of the expression levels of 36 putative miR-204 gene targets (see table 1 please). B. Principal Component Analysis (PCA) of the distribution of the 36 genes in the TGCA dataset. C. Volcano plots. Analysis of the distribution of the miR-204 levels and those of its putative target genes revealed similar relationship in both gastric cancer and cholangiocarcinoma samples. The log2 fold change is plotted on the x-axis and the negative log10 of the p-value is plotted on the y-axis.

