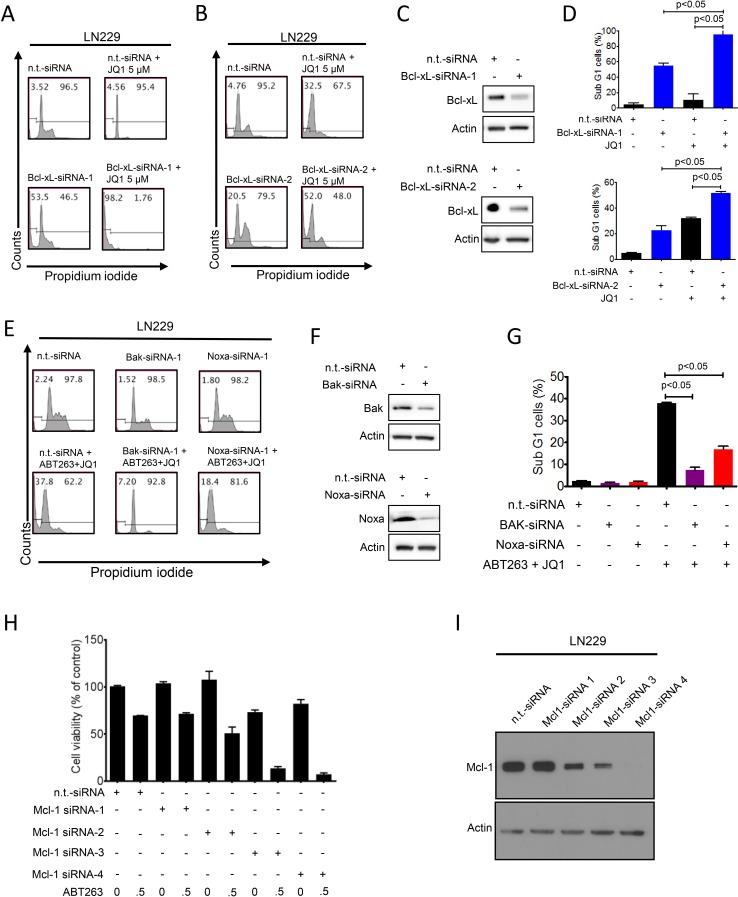
Figure 4. Functional implications of Bcl-2 family members in the combined treatment of ABT263 and JQ1.
A.-D., Representative flow plots of LN229 cells that were treated with n.t.-siRNA or 2 different Bcl-xL siRNAs prior to additional treatment with either solvent or JQ1. Staining for propidium iodide and flowcytometric analysis was performed to determine the fraction of subG1 cells. The results were quantified (D). Knockdown of Bcl-xL was confirmed by Western Blot analysis (C). Actin served as loading control (C). E.-G. LN229 cells were treated with n.t.-siRNA or Noxa-siRNA or Bak-siRNA prior to treatment with solvent or the combination of 1μM ABT263 and 5μM JQ1 as indicated for 24 h. Staining for propidium iodide and flow cytometric analysis was performed to determine the fraction of subG1 cells. Representative flow plots are shown (E). The quantifications are shown in (G). Noxa and Bak knockdowns were confirmed by Western blot analysis (F). H., LN229 cells were transfected with n.t.-siRNA or four individual Mcl-1 siRNAs for 48h. Subsequently, cells were treated with ABT263 and analyzed by CellTiter-Glo assay. The concentrations for ABT263 are in μM. Column: mean. Error bar: standard deviation (SD). I., LN229 cells were transfected as in G and analyzed for protein expression of Mcl-1. Actin served as a loading control.

