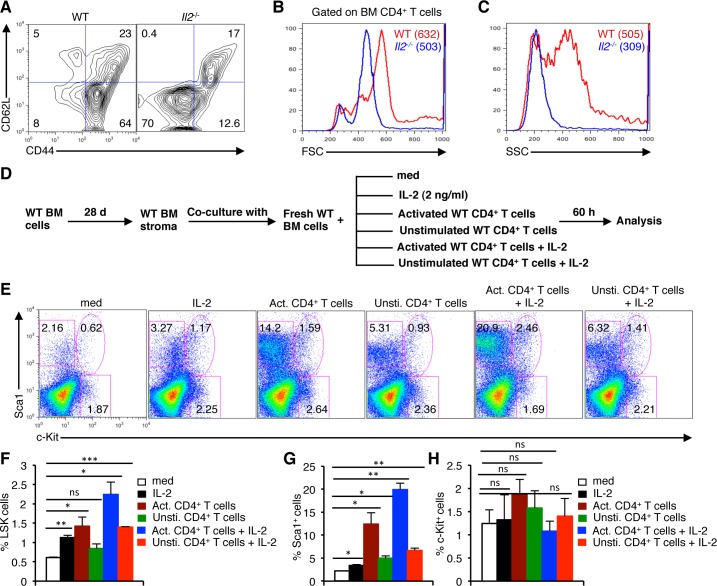
Figure 5. Activated T cells induce HSC defects in the BM.
A. Distribution of CD4+ T cells in the BM of Il2−/− mice based on CD62L and CD44 expression compared to WT mice. B. Profiles of FSC distribution, and C. SSC distribution of the BM CD4+ T cells in WT and Il2−/− mice. D. Experimental plan to analyze the involvement of activated CD4+ T cells in BM HSC maintenance. E. Flow cytometry profiles showing the influence of IL-2, of naïve or activated CD4+ T cells on the maintenance of HSCs in the BM cells-stromal cells co-culture assays. F. Quantification of LSK cells in the respective BM cells-stromal cells co-culture assays as indicated. G. Distribution of BM Lin−Sca1+, and H. Lin−c-Kit+ cells as evaluated from the BM cells-stromal cells co-culture assays in respective conditions as indicated. Numbers inside each dot plot represent percent respective population. Data are representative of 3 independent experiments, (n = 3 per group) and shown as mean ± s.d., in (F) **P = 0.0061, *P = 0.0185 or 0.0185 and ***P = 0.0002, (G) *P = 0.0135 or 0.0279 or 0.0143 and **P = 0.0029 or 0.0067, ns = not significant, one-way ANOVA.

