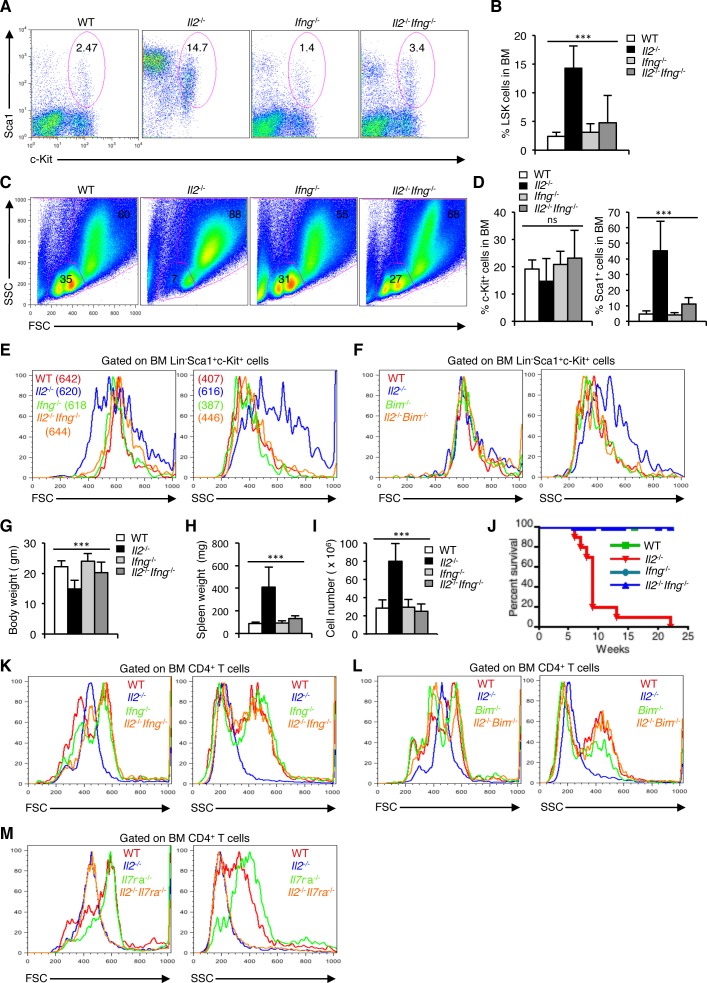
Figure 7. Enhanced IFN-γ activity leads to dysregulated hematopoiesis in Il2−/− mice.
A. Distribution of LSK cells in BM from WT, Il2−/−, Ifng−/− and Il2−/−Ifng−/− mice. B. Quantification of BM LSK cells in Il2−/−Ifng−/− mice compared to WT, Il2−/−and Ifng−/− mice. C. Distribution of BM cells in indicated mice according to their FSC and SSC pattern. D. Evaluation of c-Kit+ and Sca1+ cells distribution among lineage-negative BM cells in Il2−/−Ifng−/− mice compared to littermate control mice. E. FSC and SSC patterns of Il2−/−Ifng−/− LSK cells compared to that of WT, Il2−/− and Ifng−/− cells. F. FSC and SSC patterns of Il2−/−Bim−/− LSK cells compared to that of WT, Il2−/− and Bim−/− cells. G. Body weight, H. spleen weight, and I. splenocytes number in Il2−/−Ifng−/− mice compared to WT, Il2−/−and Ifng−/− mice. J. Survival curve for Il2−/−Ifng−/− mice compared to WT, Il2−/−and Ifng−/− mice. K. Profile of Il2−/−Ifng−/− BM CD4+ T cells according to their FSC and SSC distribution pattern compared to that of littermate control mice. L. FSC and SSC distribution of Il2−/−Bim−/− BM CD4+ T cells compared to that of littermate control mice. M. Profile of Il2−/−Il7ra−/− BM CD4+ T cells according to their FSC and SSC distribution pattern compared to that of WT, Il2−/−and Il7ra−/− mice. Numbers inside each dot plot represent percent respective population and in histograms represent the MFI. Data are representative of 3 independent experiments, (n = 3 per group) and shown as mean ± s.d., in B, D, G, H & I ***P < 0.0001, ns = not significant, one-way ANOVA.

