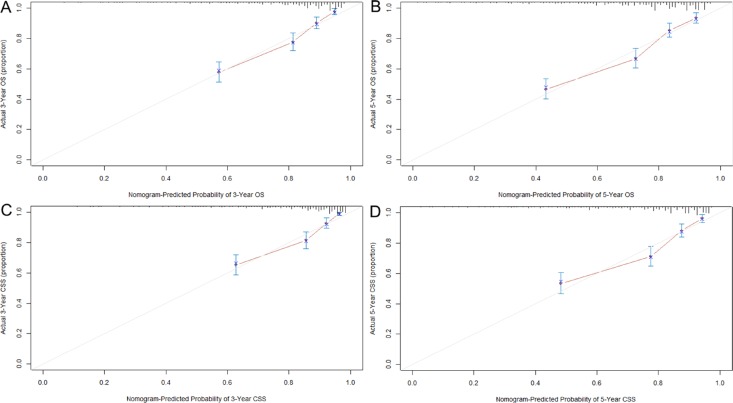
Figure 2.
Calibration curves for predicting OS (A and B) and CSS (C and D) at 3 and 5 years in the derivation set. The 45-degree straight line represents the perfect match between the actual (Y-axis) and nomogram-predicted (X-axis) survival probabilities. A closer distance between two curves indicates higher accuracy.

