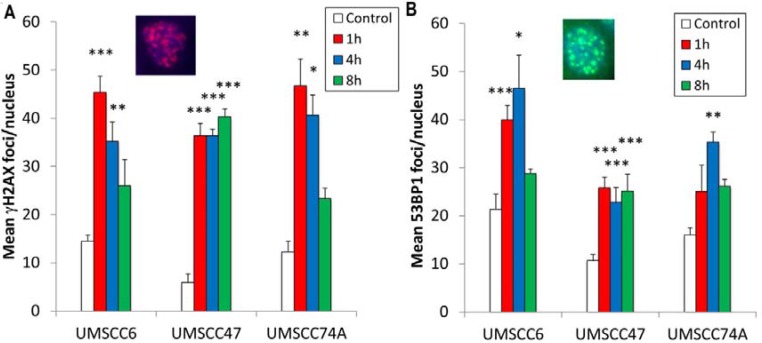
Figure 3. Analysis of IR-induced γH2AX and 53BP1 foci formation in HPV-negative and HPV-positive OPSCC cells.
OPSCC cells were irradiated (4 Gy) and (A) γH2AX and (Β) 53BP1 foci analysed by immunofluorescent staining at various time points post-IR. Shown is the mean number of foci/nucleus with standard errors from three independent experiments performed in triplicate. *p < 0.02, **p < 0.005, ***p < 0.001 as analysed by a one sample t-test of foci/nucleus at each particular time point compared to the respective untreated controls. Shown inset are immunofluorescence images showing nuclei with γH2AX or 53BP1 foci.

