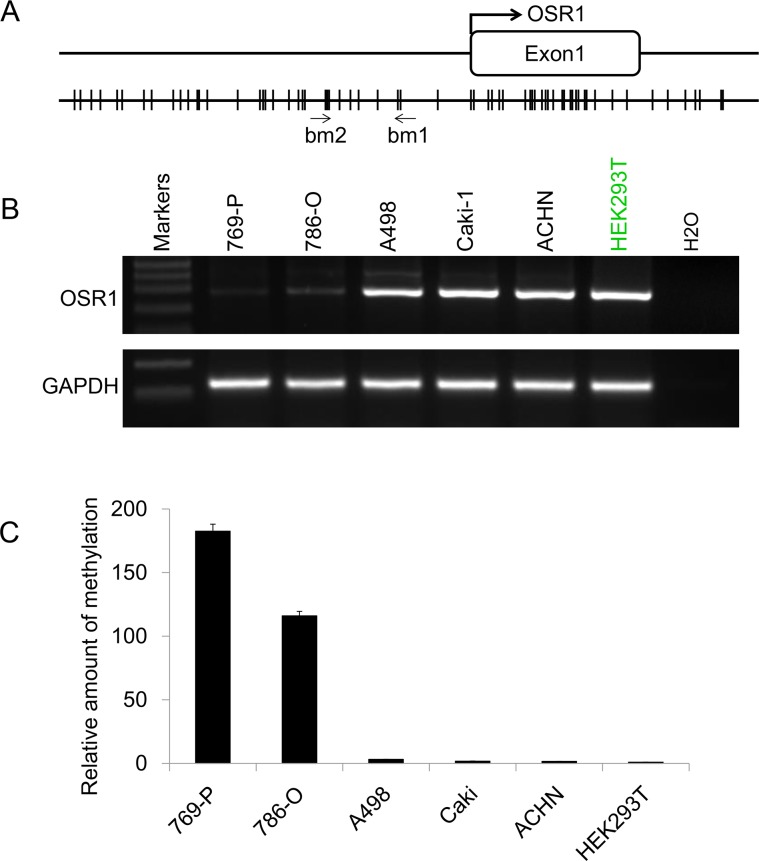
Figure 1.
A. Schematic structure of OSR1 promoter CGI. The transcription start site is indicated by a curved arrow. qMSP primers are indicated. Bm1 and bm2 designate primers designed according to the sequence of the bottom strain. B. The expression profile of OSR1 in a series of RCC cell lines. GAPDH was used as an internal control. C. qMSP results of OSR1 promoter in RCC cell lines.

