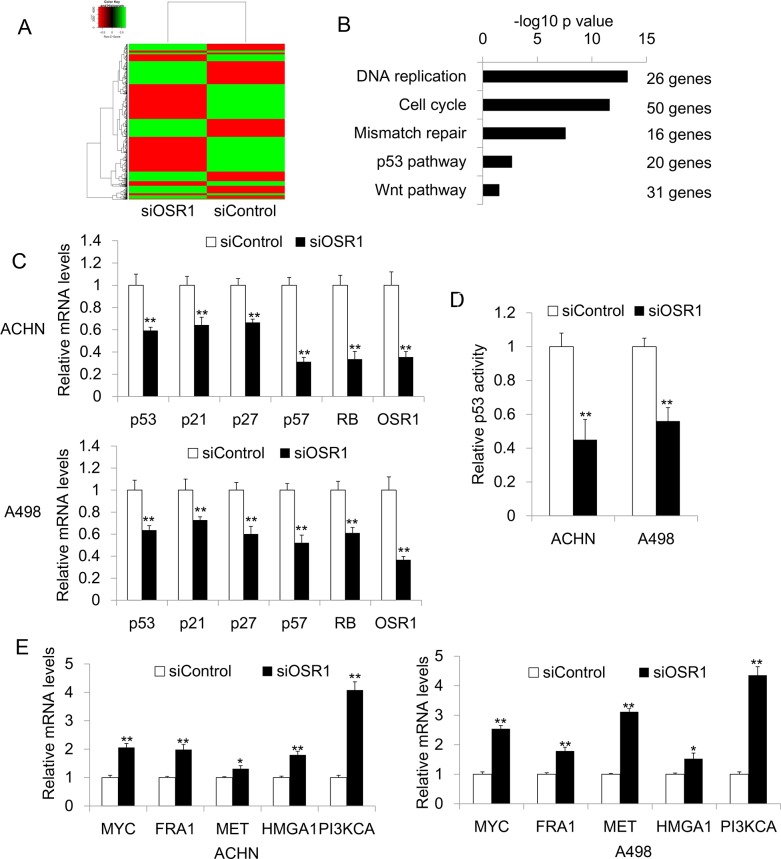
Figure 4.
A. Heatmap for RNA sequencing results from OSR1 knockdown ACHN cells and control ACHN cells. B. Go analysis for RNA sequencing results. C. Confirmation of downregulated genes in ACHN and A498 cells by quantitative real-time PCR. **, P<0.01. D. P53 luciferase assay in siControl-transfected or siOSR1-transfected ACHN and A498 cells. **, P<0.01. E. Validation of upregulated genes by real-time PCR in ACHN an A498 cells. *, P<0.05; **, p<0.01.

