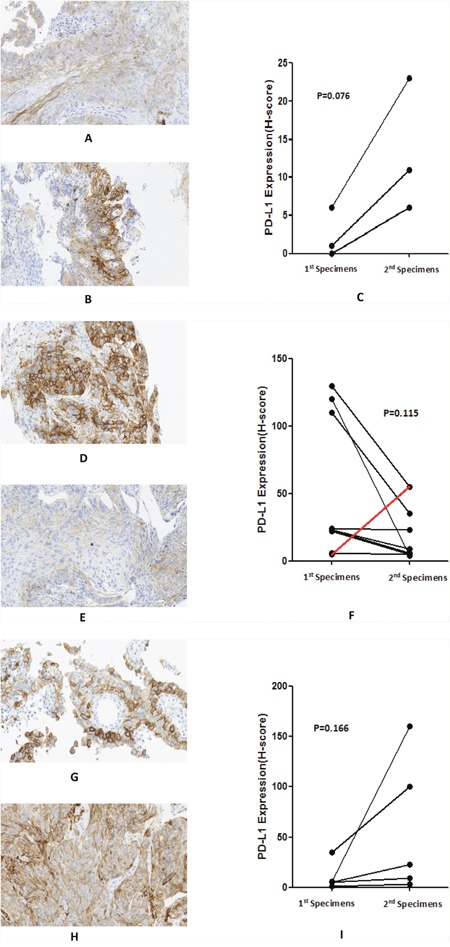
Figure 6. Changes in PD-L1 expression in paired specimens before and after different treatments: A-C: no treatment, H-score from 6 to 23; D-F: 2 cycles chemotherapy (just 1 sample showed an increase [red line]), H-score from 120 to 4; G-I: 4 or more cycles chemotherapy, H-score from 35 to 100.

