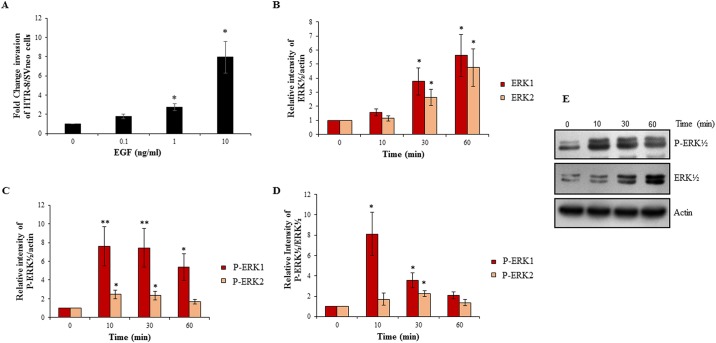
Fig 1. EGF treatment of HTR-8/SVneo cells increases invasion and activates ERK½ signaling pathway.
Cells were treated with varying concentrations of EGF (0.1, 1, 10 ng/ml). Panel A shows fold change in invasion of EGF-treated cells with respect to untreated naive control cells. Values are expressed as mean ± SEM of three independent experiments performed in duplicates. Further experiments were performed by treating cells with optimized EGF concentration (10 ng/ml) for varying time periods (10, 30 and 60 min) followed by Western blot analysis to determine activation of ERK½ as described in Materials and Methods. Panel B represents the densitometric plot of relative increase in total ERK 1 and 2 in EGF treated cells with respect to untreated control as compared with actin. Panels C and D represent the densitometric plots showing the relative increase in phosphorylated ERK 1 and 2 in EGF treated cells with respect to untreated control as compared to actin and total ERK 1 and 2 respectively. Panel E shows representative blots from one of the three independent experiments. The data in Panels B, C and D is represented as mean ± SEM of three independent experiments and band intensities of phosphorylated and total ERK½ were normalized with respect to loading control during densitometric analysis. *p < 0.05 and **p < 0.01 with respect to untreated control cells.

