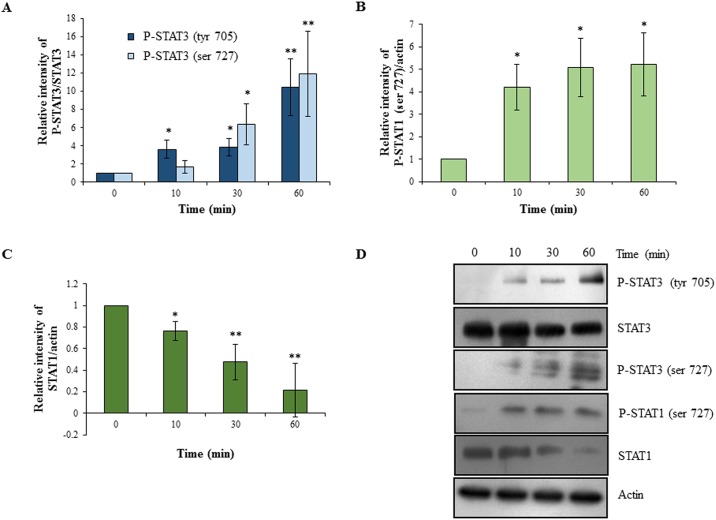
Fig 2. Activation of STAT3 and STAT1 dependent signaling following EGF treatment of HTR-8/SVneo cells.
HTR-8/SVneo cells were treated with EGF (10 ng/ml) for varying time periods followed by Western blot analysis to determine activation of STAT1 and STAT3 as described in Materials and Methods. Panel A represents the densitometric plot showing relative increase in phosphorylated STAT3 (ser 727 and tyr 705) levels in EGF treated cells with respect to untreated control as compared to total STAT3. Panel B represents the densitometric plot showing relative increase in phosphorylated STAT1 (ser 727) levels in EGF treated cells with respect to untreated control as compared to actin. Panel C represents the densitometric plot showing relative decrease in total STAT1 levels in EGF treated cells with respect to untreated control as compared to actin. Panel D shows representative blots from one of the three independent experiments. The data in Panels A, B and C is represented as mean ± SEM of three independent experiments and band intensities of phosphorylated and total STAT1 & STAT3 were normalized with respect to loading control during densitometric analysis. *p < 0.05 and **p < 0.01 with respect to untreated control cells.

