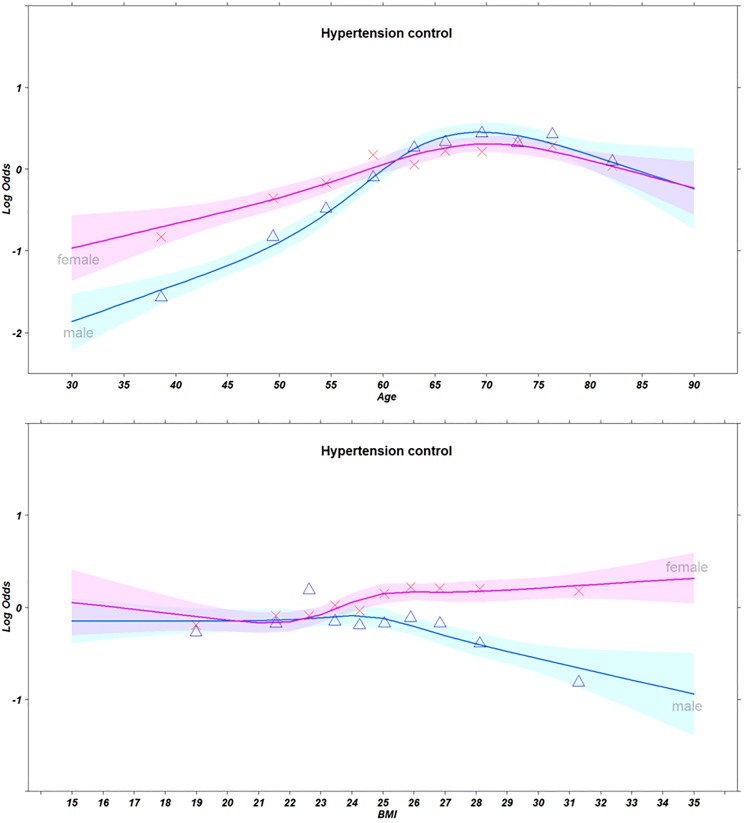
Fig 2. Logit proportions of hypertension control by sex and deciles of age (first) and BMI (second) for n = 27,887 subjects, along with spline fits (smooth curves).
*Cubic spline was adjusted according to sex, individual income quartile, education, occupation, alcohol intake, smoking status, and body mass index. Shaded bands are pointwise 0.95 confidence limits for predicted log odds ratio. Triangle marks: Male proportions, X marks: Female proportions.

