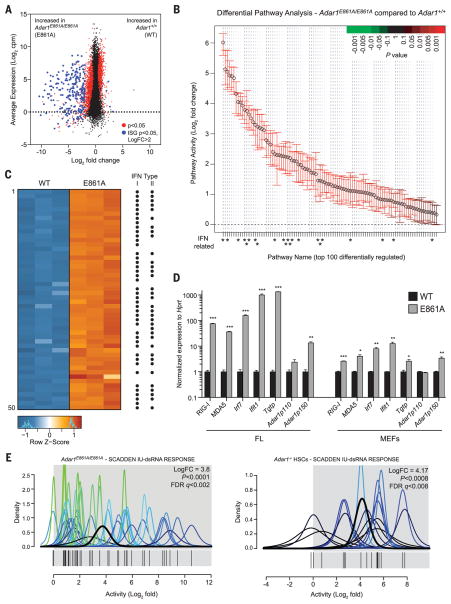
Fig. 2. Absence of editing transcriptionally phenocopies loss of ADAR1.
(A) MA plot comparing gene expression in WT and E861A E12.5 FL. Red dots, differentially expressed genes; blue dots, differentially expressed ISGs. (B) QuSAGE analysis of the top 100 differential pathway signatures ranked by fold enrichment and P value. (C) Heat map of the 50 most differentially expressed genes. Black dots indicate known ISGs. (D) qRT-PCR of ISGs in E861A compared with controls in FL and MEFs. Results are mean ± SEM (n = 3). *P < 0.05, **P < 0.005, and ***P < 0.0005 compared with Adar1+/+. (E) IU-dsRNA response gene set in E861A compared with WT samples (left) and Adar1−/− HSCs compared with controls (right).

