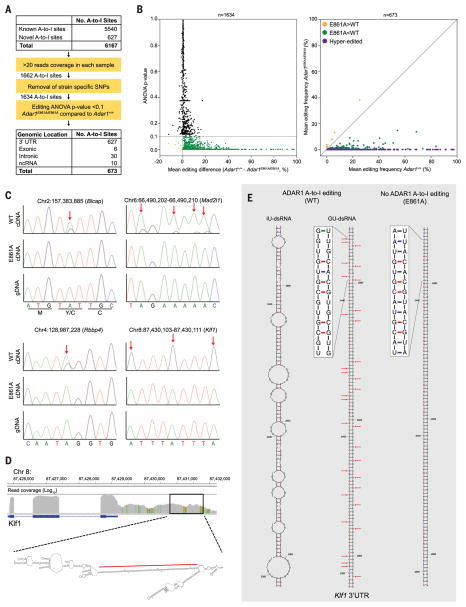
Fig. 3. Defining the ADAR1 FL editome.
(A) Summary of A-to-I editing site analysis in FL. SNPs, single-nucleotide polymorphisms; ANOVA, analysis of variance; ncRNA, noncoding RNA. (B) Mean editing difference for sites with >20 reads (left, n = 1634). Mean editing frequency of differentially edited sites between E861A and controls (right, n = 673). (C) Genomic DNA (gDNA) (bottom) and complementary DNA (cDNA) (top and middle) Sanger sequencing validation of editing sites. Red arrows highlight edited adenosine. (D) Integrative Genomics Viewer image of Klf1 in WT E12.5 FL and predicted secondary structure of 3′UTR. The red line denotes the region depicted in (E). (E) Predicted secondary structure ofa 212–base pairdsRNA stem loop from the 3′UTRof Klf1, with inosine (IU-dsRNA, left) and guanosine (GU-dsRNA, middle) in place of adenosine at the edited sites. Right, predicted secondary structure with no A-to-I editing.

