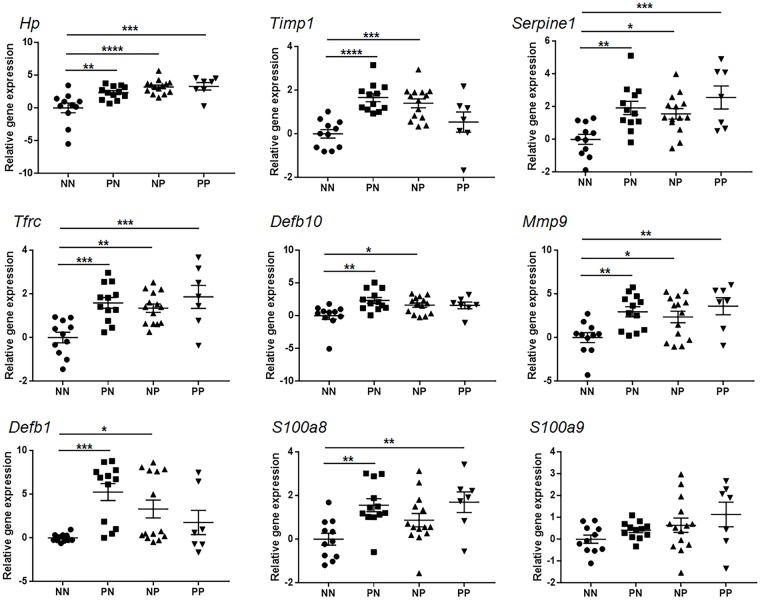
Fig 3. Gene expression level of biomarkers in MAP-infected cattle.
The gene expression level of biomarker genes in cattle infected with Mycobacterium avium subspecies paratuberculosis compared to non-infected cattle. The data are shown as scatter plots with each dot representing a single animal. (*, p<0.05 **, p<0.01 ***, p<0.001 ****, p<0.0001).

