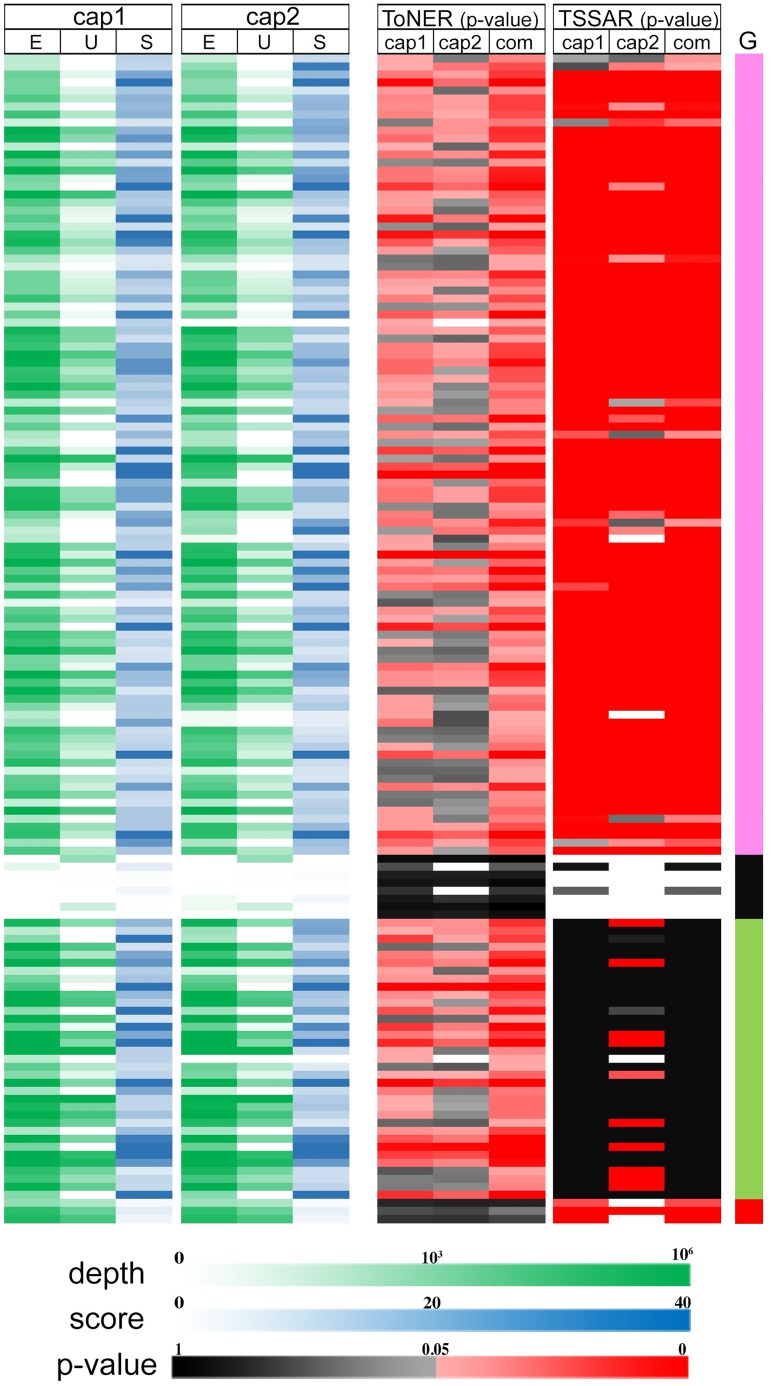
Fig 3. Cappable-seq data and statistics of enrichment reported by ToNER and TSSAR for known transcription start sites (TSS).
The Cappable-seq data and statistics of enrichment for 146 known E. coli TSS annotated in RegulonDB are shown in two parts. The first part on the left displays the normalized read depth as indicated by the green color gradient for the enriched library (E) and unenriched library (U), and the associated ToNER enrichment score (S) as indicated by the blue color gradient for each TSS in the Cappable-seq experimental replicate1 (cap1) and replicate 2 (cap2) datasets. The second part on the right displays nucleotide enrichment p-values obtained from ToNER and TSSAR analyses. For each software, the p-values for replicate 1 (cap1), replicate 2 (cap2), and Fisher’s combined p-values from both replicates (com) are shown. P-values of nucleotide enrichment are indicated in black color gradient for non-significant positions, whereas the significantly enriched positions (p<0.05) are shown in red color gradient. Positions in white have no reported p-value. This can occur because there are no mapped reads, and in case of TSSAR, positions with no statistic can also occur when there are more mapped reads in the unenriched library compared with the enriched library. The annotated TSS positions are grouped based on combined p-values, as indicated by the color bars in the ‘G’ column on the far right: positions detected with significant enrichment (p<0.05) by ToNER and TSSAR (pink); not detected by either software (black); detected by ToNER only (green) and detected by TSSAR only (red).

