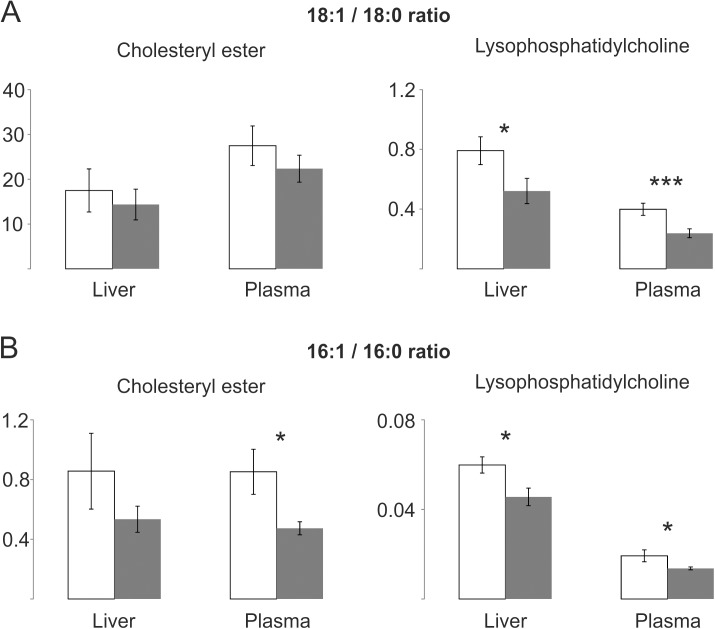
Fig 7. SCD1 related ratios of lipid classes with only one single fatty acid side chain in liver and plasma of ATP10D deficient and transgenic mice on high fat diet.
Lipid species were quantified by electrospray ionization tandem mass spectrometry. Mean values are shown together with the standard deviation (n = 4). ATP10D deficient, white bars; ATP10D transgenic, grey bars. *** p<0.001; * p<0.05.

